
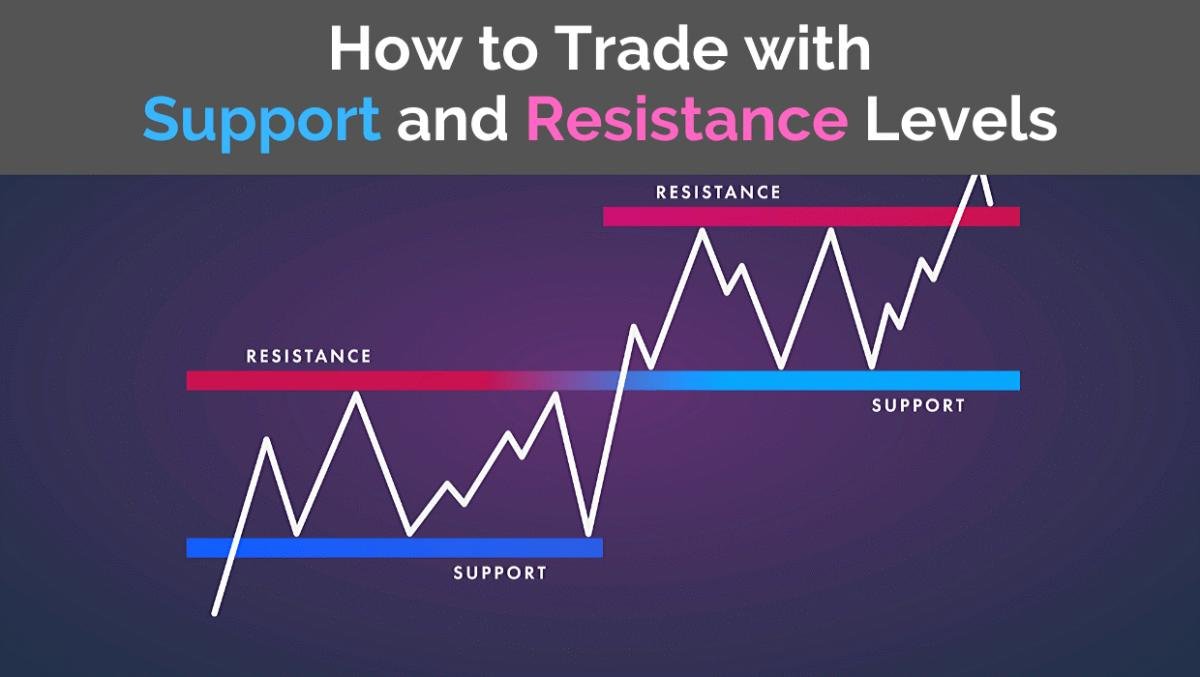
Forex support and resistance are the price zones where buying or selling pressure has repeatedly been strong enough to pause, reverse, or slow a move. Support is a zone where price has tended to stop falling; resistance is a zone where price has tended to stop rising. Traders mark these zones to plan entries, stops, and targets around areas where price is more likely to react.
This guide is for retail traders working through the early-to-intermediate stage of technical analysis: why these levels form, several ways to mark them on a chart, how to judge which levels carry more weight, and how to structure a trade around a bounce or a break with defined risk. Nothing here is a signal or a guarantee — it’s an explanation of a widely used charting method.
What Is Support and Resistance in Forex
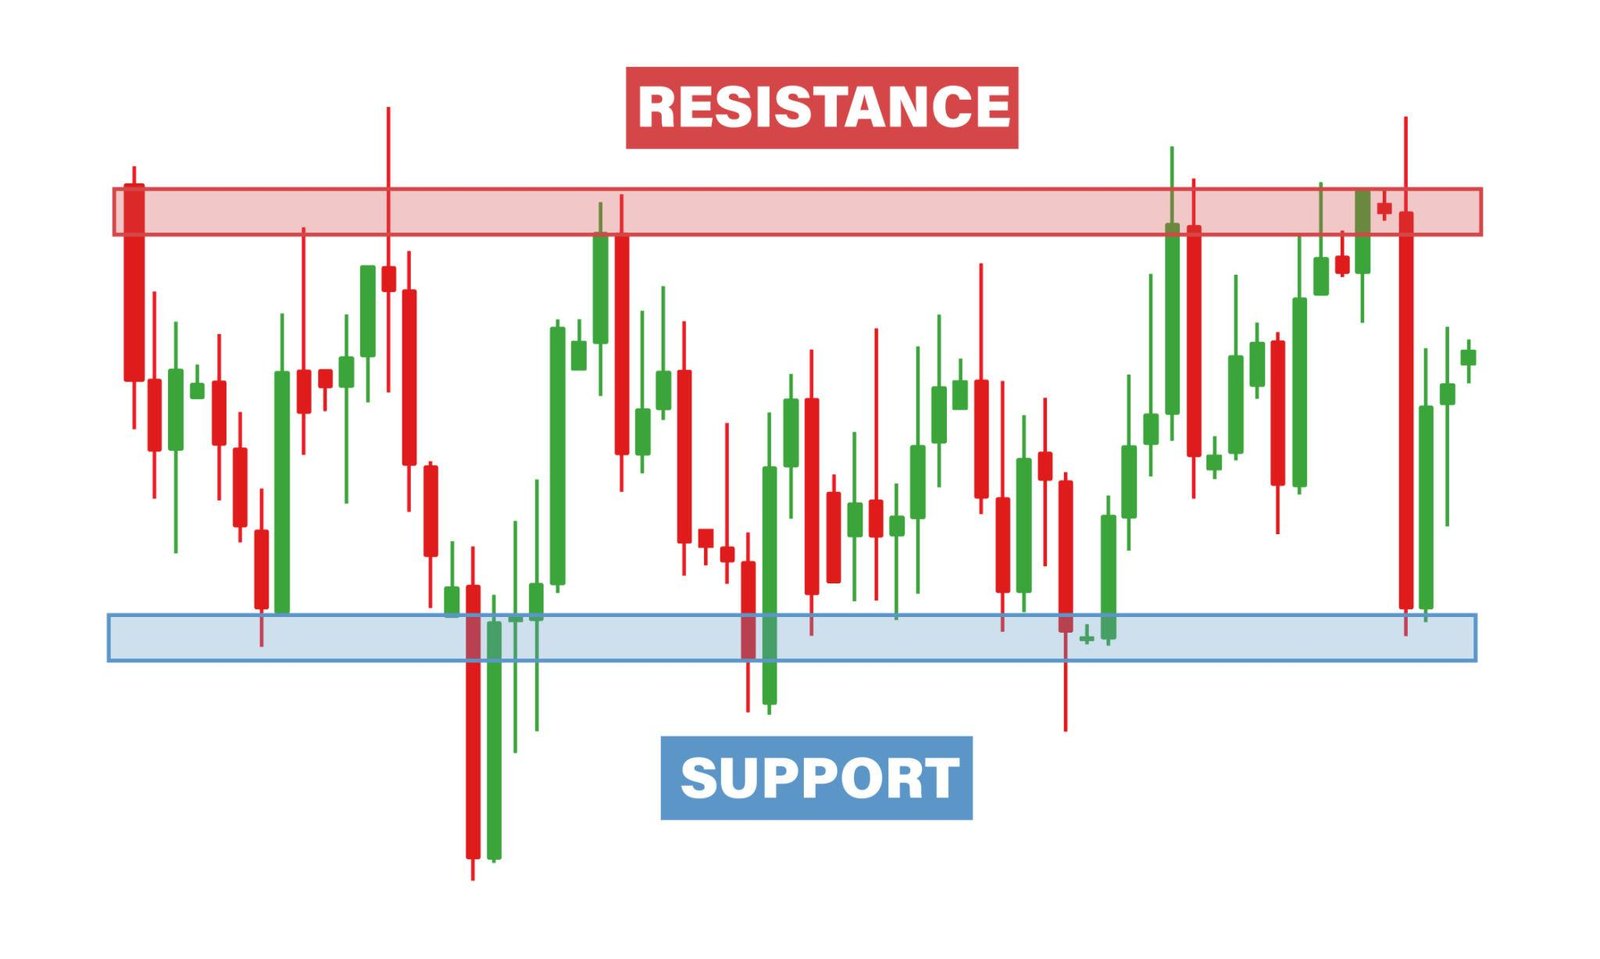
Support and resistance describe recurring price zones, not exact lines. Support is a price area where demand has previously been strong enough to absorb selling and stop a decline. Resistance is a price area where supply has previously been strong enough to absorb buying and stop an advance. When resistance is broken and price later returns to it from above, that zone often starts acting as support — and the reverse applies when support is broken and revisited from below.
The mechanism behind this is ordinary market structure, not a mystical pattern. Orders cluster around certain prices for identifiable reasons:
- Prior turning points. Traders who missed an earlier reversal often place orders at the same price the next time it’s approached, since that price already proved it could turn the market once.
- Round numbers. Levels such as 1.1000 or 150.00 attract disproportionate order flow because they’re easy reference points for stops and limit orders — not because of any special property of the number itself.
- Institutional order clustering. Large participants tend to execute sizeable orders in the same general price areas repeatedly, since those areas already have established liquidity.
None of this guarantees a level will hold on any given test — it explains why certain zones matter more than others.
How to Identify Support and Resistance Levels
Most traders combine several of the following approaches rather than relying on just one.
Horizontal Levels From Swing Highs and Lows
Mark the price of each clear swing high (a peak with lower highs on both sides) and swing low (a trough with higher lows on both sides), then draw a horizontal line through each. The more times price has reacted near the same area, the more significant traders tend to treat it — as a zone a few pips wide, not one exact price.
Trendline (Dynamic) Support and Resistance
A trendline connects a series of rising lows (uptrend support) or falling highs (downtrend resistance). Unlike a horizontal level, its price value moves over time, which is why it’s called a dynamic level. It generally needs two touchpoints to draw and a third to meaningfully confirm it.
Psychological / Round-Number Levels
Whole and half numbers (1.2000, 1.2500, 150.00) often act as support or resistance simply because so many participants use them as order-placement reference points — worth marking even without a prior swing at that exact price.
Moving Averages and VWAP
A moving average (commonly the 50 or 200-period) can act as a dynamic level because it represents an average price many participants are watching at once. The VWAP (volume-weighted average price) plays a similar role intraday — price returning to VWAP after moving away is a commonly watched reaction zone, particularly among participants who use it as an execution benchmark.
Fibonacci Retracement Levels
A Fibonacci retracement is drawn between a recent swing high and low, plotting horizontal lines at ratios (commonly 38.2%, 50%, and 61.8%) of that move. These ratios have no proven causal mechanism on their own — their usefulness comes largely from how widely they’re watched, creating a degree of self-fulfilling order clustering. Best used as one input for confluence, not a standalone signal.
Pivot Points
Pivot points are calculated levels derived from the previous session’s high, low, and close, producing a central pivot plus support (S1–S3) and resistance (R1–R3) levels around it. Because the calculation is standardized and widely available, many intraday traders reference the same levels, reinforcing their relevance.
Order Blocks and Institutional Levels
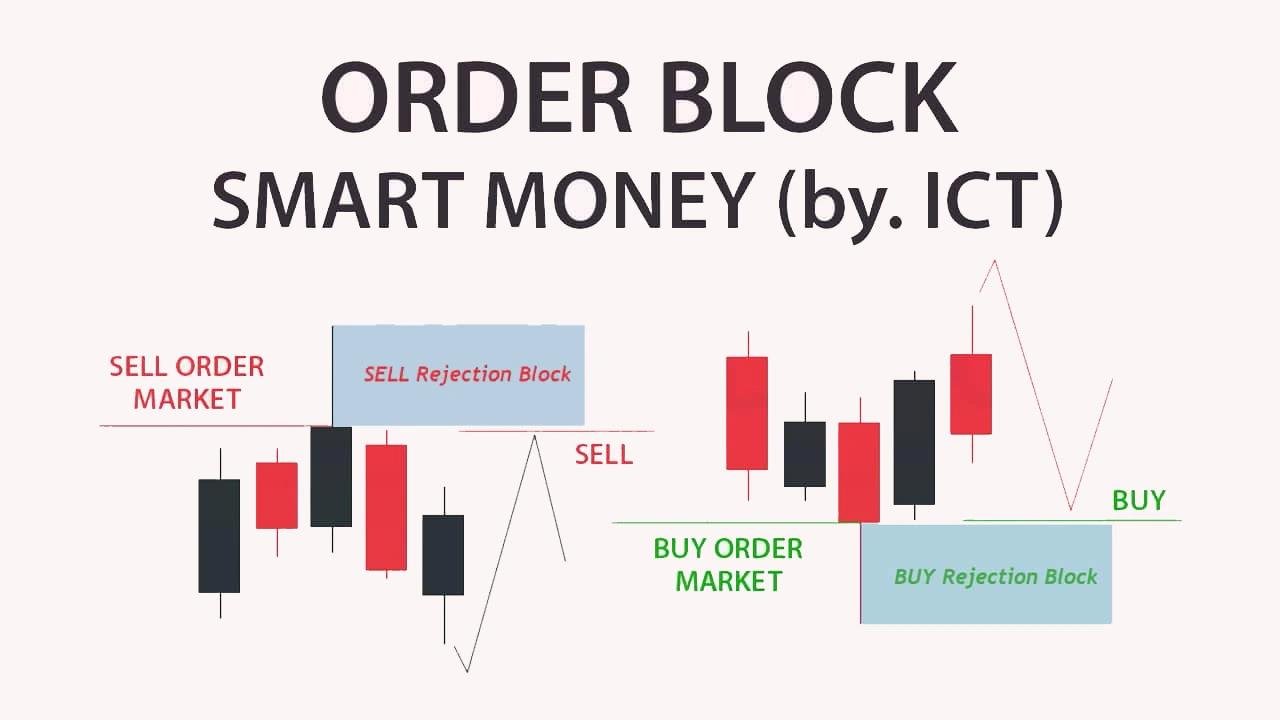
An order block is a specific price-action pattern — typically the last opposing candle before a strong, decisive move — interpreted as the area where institutional orders were likely concentrated before that move began. Traders mark that zone and watch for price to return to it, on the reasoning that unfilled orders there could still be active.
Order blocks are one identification method among the several above, not a separate strategy. They’re most useful as an added layer of confluence with a horizontal level, trendline, or Fibonacci zone identified through other means.
Multi-Timeframe Confirmation
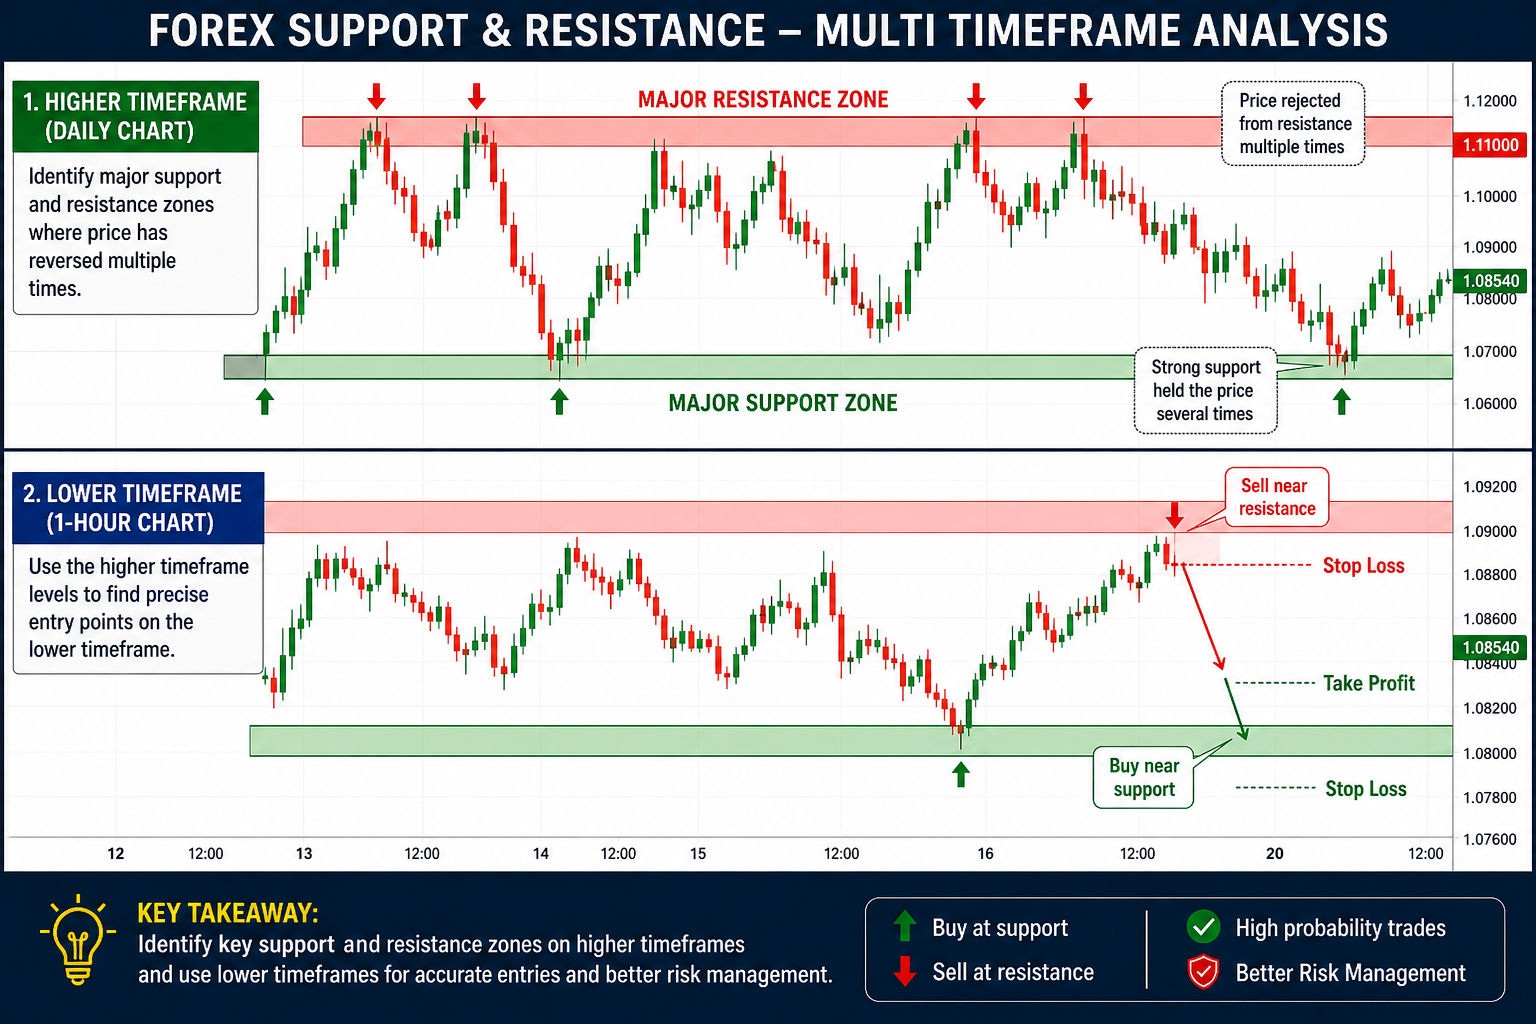
The same price area can look different depending on the chart timeframe. A level minor on a 15-minute chart may sit directly on a major swing point on the Daily chart, and vice versa. Multi-timeframe analysis means checking a level’s significance across at least two or three timeframes (for example H1, H4, and Daily) rather than trading a line drawn on one chart in isolation.
Levels visible on higher timeframes tend to draw attention from a broader range of participants, simply because more traders default to watching the higher timeframe. A lower-timeframe level that also aligns with a higher-timeframe level is generally treated as more significant than one that doesn’t.
Support and Resistance Confluence
Confluence is a level being reinforced by more than one method at once. A zone that lines up a prior swing high, a 61.8% Fibonacci retracement, a round number, and a Daily pivot point simultaneously is generally treated as stronger than a level identified by only one of those methods, because it represents overlapping reasons for orders to cluster there.
This is also the honest answer to “how accurate are these levels”: no single level reliably holds every time. Confluence prioritizes which levels are more likely to matter — it doesn’t predict outcomes with certainty.
| Confluence factor | What it adds |
|---|---|
| Prior swing high/low | Price has reacted at this zone before |
| Fibonacci retracement | A widely watched ratio of the recent move |
| Round number | Concentrated order placement around a memorable price |
| Pivot point (daily/weekly) | A standardized level referenced across platforms |
| Trendline / moving average / VWAP | A dynamic level many participants track simultaneously |
Step-by-Step: Trading a Support/Resistance Bounce or Break
The following outlines a common structure once a level has been identified with reasonable confluence — a description of a method, not a recommendation to enter any specific trade.
Trading the Bounce
- Mark the level using at least two identification methods above.
- Wait for price to reach the zone rather than anticipating the reaction.
- Look for a confirmation candle — a rejection wick or engulfing candle — rather than entering the instant price touches it.
- Place the stop beyond the level, not exactly on it, to allow for normal price noise.
- Set a target at the next identified level in the direction of the trade, sized to fit your own risk-to-reward plan.
Trading the Breakout and Retest
- Wait for a decisive close beyond the level rather than a brief intrabar poke through it.
- Watch for a retest — price often returns to the broken level before continuing, now testing it in the opposite role.
- Confirm the retest holds with a rejection candle before entering.
- Place the stop back beyond the broken level, since a failed retest suggests the breakout was likely false.
- Target the next relevant level in the breakout direction.
Why Levels Break (False Breakouts vs Real Breaks)
A level breaks when the orders absorbing price there are overwhelmed by new buying or selling — nothing mysterious beyond sufficient volume pushing through the resting orders. Often price pushes through briefly and reverses, producing a false breakout (a fakeout).
A few structural differences commonly distinguish a false breakout from a real one, though none is a certainty:
- Close vs wick. A candle closing beyond the level is generally treated as more reliable than a brief intrabar wick through it.
- The retest reaction. After a genuine break, a retest tends to hold as the new level; after a false break, price often pushes straight back through without pausing.
- Volume and momentum. A break on a clear increase in volume or momentum is generally treated as more likely to hold than one on thin, directionless action.
Waiting for the retest before entering is a common way traders try to filter false breakouts, at the cost of a less favorable entry price than trading the initial break itself.
Risk Management Around Key Levels
How a stop-loss is placed relative to a level matters as much as identifying the level in the first place.
- Stop placement beyond, not at, the level. A stop placed exactly on a round number or obvious swing point sits in one of the most crowded areas for resting orders — where price is more likely to briefly spike through before reacting, sometimes called a level being “hunted.” Placing the stop a reasonable distance beyond the level instead reduces the chance of being stopped out by ordinary noise.
- Position sizing near high-volatility zones. Levels that have produced sharp reactions before can produce wider, faster swings on the next test. Sizing a position so the stop distance still fits an acceptable dollar or percentage risk is separate from level selection.
- One trade idea, one plan. Entering without a predetermined stop and target, then moving the stop further away if the trade moves against the position, removes the risk control the method is meant to provide.
Common Mistakes in Support and Resistance Trading
- Treating levels as exact prices, not zones. Expecting a reversal at the precise pip of a drawn line leads to premature entries and overly tight stops.
- Trading a single-method level with no confluence. A line from one swing high with nothing else lining up is a weaker reference point, yet it’s often traded with the same confidence.
- Ignoring the higher timeframe. A level that looks strong on a 5-minute chart can be irrelevant against the broader Daily structure.
- Entering on the first touch without confirmation. Taking every touch of a level, rather than waiting for a confirmation candle, means trading reactions that never actually happen.
- Chasing a breakout without waiting for the retest. Entering immediately on the breakout candle is one of the more common ways traders get caught in false breakouts.
- Placing stops exactly on the level. This puts the stop in one of the more crowded, noise-prone areas of the chart, as covered above.
Can Beginners Use Support and Resistance?
Support and resistance is generally one of the more accessible technical-analysis concepts to start with — it needs no specialized indicator, and the core idea is intuitive once shown on a chart. Beginners typically benefit from starting with a single method, most often horizontal swing highs/lows, practiced on a demo account before layering in Fibonacci retracement, pivot points, or order blocks. Combining every method at once before understanding any one well tends to produce clutter rather than clearer decisions.
Frequently Asked Questions
What is the difference between support and resistance in forex?
Support is a zone where buying has previously stopped a decline; resistance is a zone where selling has previously stopped an advance. A broken level can later swap roles.
How do you draw support and resistance levels correctly?
Mark prior swing highs/lows, trendlines, round numbers, and the other methods above, then treat each as a zone a few pips wide, not one exact price.
How accurate are support and resistance levels?
No level holds every time. Levels backed by confluence are generally treated as more significant, but reactions are never guaranteed.
What is an order block in forex trading?
The last opposing candle before a strong move, treated as a zone where institutional orders may still be resting. One identification method among several.
What causes a false breakout at a level?
A brief surge of orders pushes price through a level without enough follow-through to sustain the move, and price reverses back shortly after.
Can beginners trade support and resistance levels?
Yes — it’s one of the more accessible concepts to start with, provided beginners practice one method on a demo account before layering in more.
Conclusion
Forex support and resistance is less about drawing one perfect line and more about layering identification methods — swing highs/lows, trendlines, round numbers, moving averages and VWAP, Fibonacci retracement, pivot points, and order blocks — and weighing a level’s strength by how much confluence backs it. Combined with defined risk management around stop placement, this is the practical framework most traders build on before adding strategy-specific rules.
Educational content only, not financial advice. This guide explains a common charting method used in technical analysis. It is not a recommendation to buy, sell, or trade any specific instrument, and it does not guarantee any trading outcome. Forex trading carries a risk of loss. Consider your own circumstances and, if needed, seek independent, regulated financial advice before trading.