
The forex triangle pattern strategy is one of the most reliable and widely used approaches in technical trading. Triangles appear across all currency pairs and timeframes, signaling moments when price consolidates before making a decisive directional move. Whether you are a swing trader looking for high-probability setups or a day trader seeking momentum entries, understanding how to read and trade triangle patterns can dramatically sharpen your edge. This article covers everything you need to master this strategy — from identifying the three main triangle types to executing forex triangle breakout entries, placing stop-losses, calculating measured-move targets, and filtering out the false breakouts that trap inexperienced traders.
What Is a Triangle Pattern in Forex?
A triangle pattern forms when price action consolidates into a progressively narrower range. As buyers and sellers fight for control, each successive swing produces a lower high or a higher low — or both — causing the trading range to contract. Drawn correctly, the upper and lower boundaries converge toward a point called the apex. This compression of volatility reflects genuine indecision, and the energy building inside that contraction typically releases in a sharp, sustained move once price finally breaks out.
Triangle patterns belong to the broader family of consolidation patterns. They most often appear as continuation patterns — pausing within an existing trend before price resumes in the original direction — but they can also signal reversals when the context demands it. For a triangle to be valid, each trendline must have at least two confirmed touches; a single touch is just a guess, two touches define a line, and three touches confirm it.
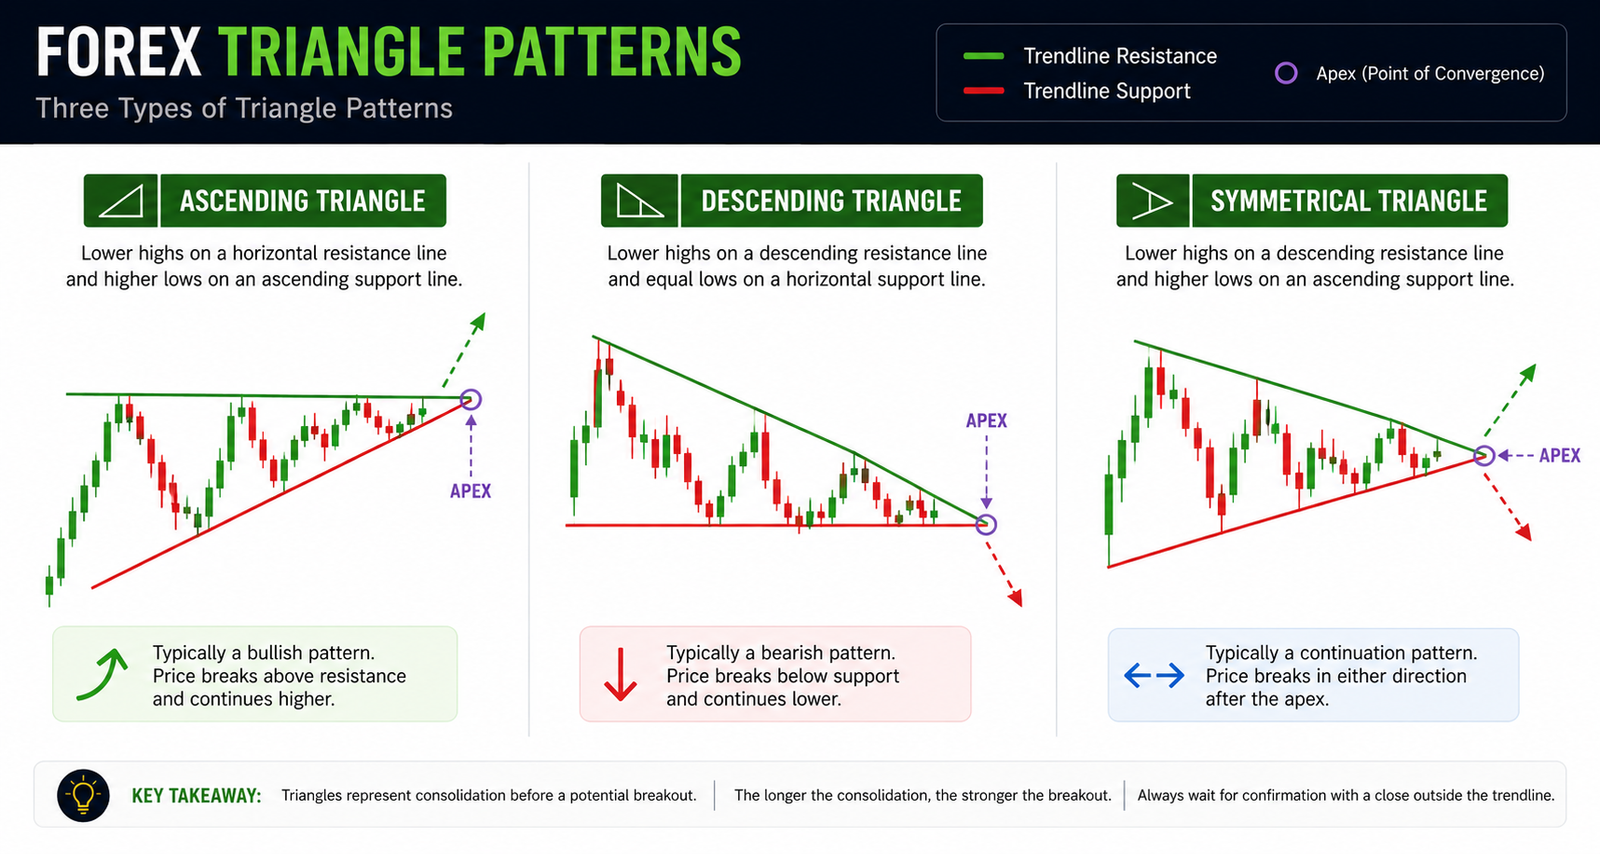
Fig 1.1 Strategy illustrated on a forex chart
The Three Main Triangle Types
Ascending Triangle Forex
The ascending triangle forex pattern features a flat horizontal resistance line across the tops and a rising trendline connecting a series of higher lows. The flat top shows sellers defending a specific price level consistently, while buyers keep stepping in at progressively higher prices. This structure has a bullish bias because the rising lows show buying pressure increasing with every pullback. The textbook breakout direction is upward, but roughly 21% of ascending triangles break downward according to chart pattern research, so a decisive candlestick close above resistance is non-negotiable before entering.
Descending Triangle Forex
The descending triangle is the mirror image, with a flat horizontal support line across the lows and a falling upper trendline connecting progressively lower highs. Sellers consistently step in at lower prices while buyers defend the same flat support level, giving the pattern a bearish bias. The longer price holds flat support while the highs decline, the more trapped buyers accumulate near that support — and when the breakdown finally comes, those trapped longs become forced sellers, accelerating the move downward.
Symmetrical Triangle Forex
The symmetrical triangle has no inherent directional bias. Both the upper trendline (connecting lower highs) and the lower trendline (connecting higher lows) slope toward the apex at roughly equal angles. Neither buyers nor sellers are in clear control, so the safest approach is to wait for the breakout to confirm direction before committing. One important nuance: symmetrical triangles that form after a strong trend tend to resolve in the direction of that trend.
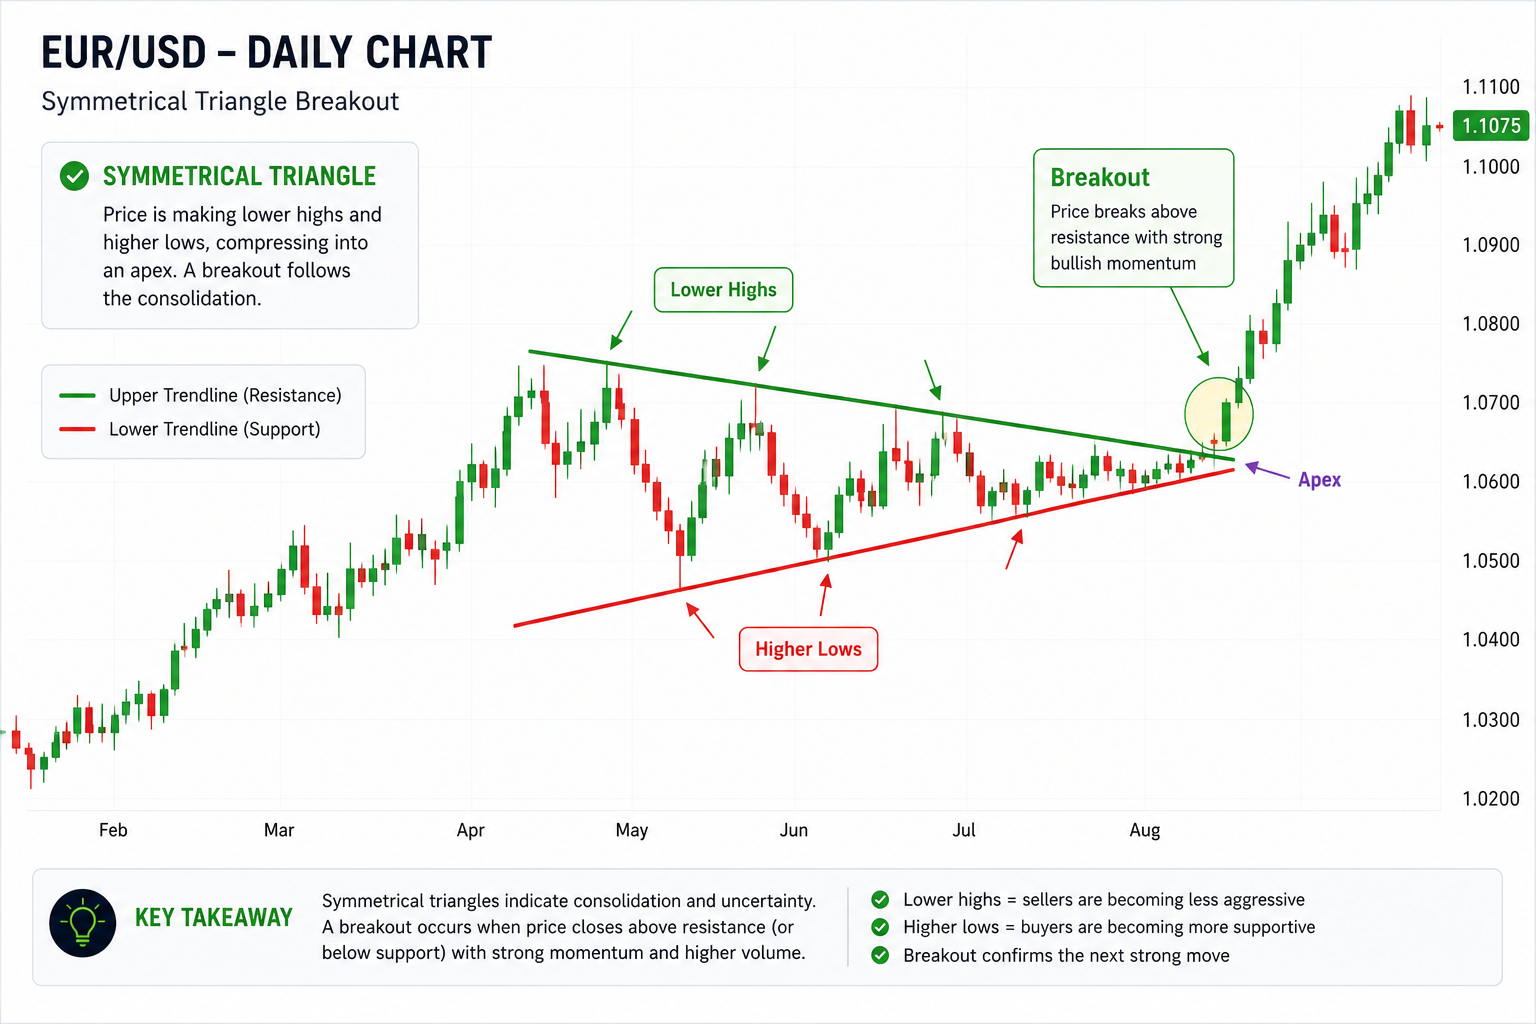
Fig 1.2 Symmetrical triangle forex breakout
How to Draw Triangle Patterns Correctly
Accurate construction separates professional chart reading from guesswork. Start by identifying significant swing highs and swing lows within the consolidation. Connect at least two swing highs to form the upper trendline and at least two swing lows to form the lower trendline. The lines should genuinely contain the price action — minor wicks that pierce slightly are acceptable, but major violations indicate the trendline is poorly drawn. Triangle patterns on the H4, Daily, and Weekly charts tend to produce cleaner, more reliable breakouts than those on the M15 or M5, where market noise creates many false signals.
Trading the Forex Triangle Breakout
There are two primary ways to enter a forex triangle breakout trade. The first is a direct breakout entry: place a buy-stop just above the breakout trendline or a sell-stop just below the breakdown trendline, catching the full move at the cost of exposure to false breakouts. The second is a retest entry: after a breakout, price frequently pulls back to retest the broken trendline, and entering on the bounce reduces risk through additional confirmation, though some breakouts never retest. Many experienced traders combine both, entering a partial position on the breakout and adding on a confirmed retest.
The most important rule is to wait for a decisive candlestick close beyond the trendline, not just an intraday pierce. A false pierce that closes back inside is a warning sign, not a signal. A breakout accompanied by a strong, full-bodied candle is far more reliable than a weak, hesitant move, and tick volume can serve as a reasonable proxy for participation in the spot forex market.
Setting Price Targets Using the Measured-Move Method
The measured-move method — sometimes called the height-of-the-triangle method — is the standard approach for calculating a price target. Measure the vertical height of the triangle at its widest point, then project that distance from the breakout point in the direction of the breakout. For example, an ascending triangle 150 pips tall produces a minimum target of 150 pips above the breakout. This is a minimum estimate; significant moves often carry well beyond it, especially on higher timeframes with strong trend alignment.
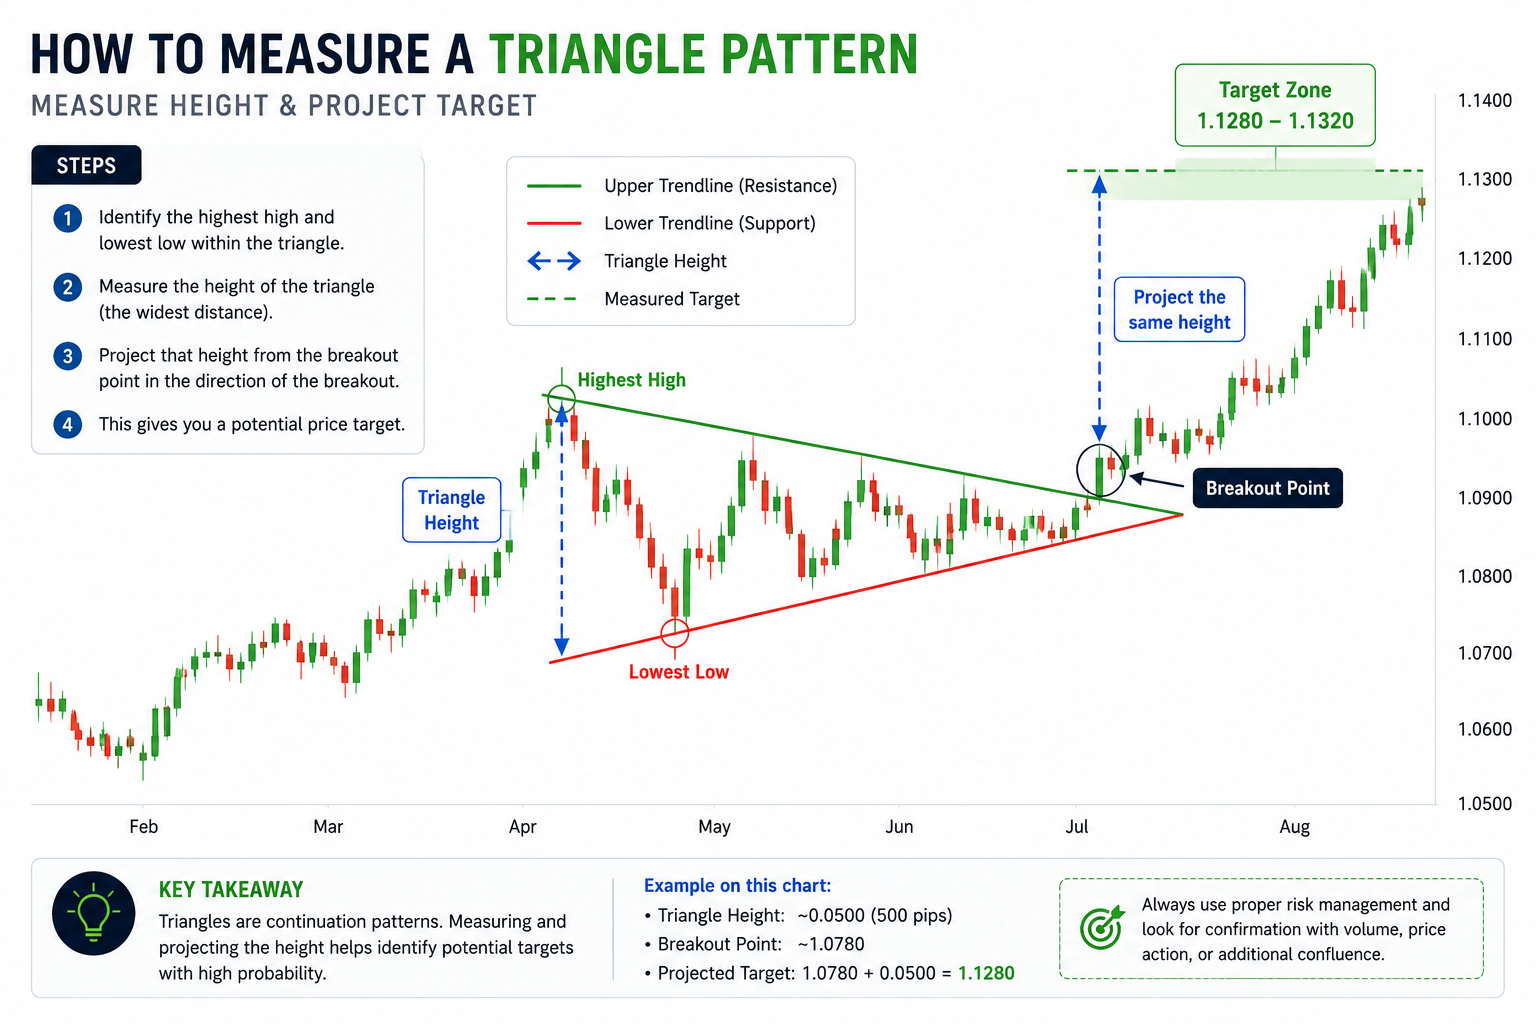
Fig 1.3 Measured move target method for forex
Stop-Loss Placement and Pattern Comparison
For a bullish breakout, your stop goes below the most recent swing low within the triangle — typically the last higher low on the rising trendline. For a bearish breakdown, your stop goes above the most recent swing high. Add a buffer of 10–20 pips beyond the logical stop level to avoid being triggered by a normal retest of the broken trendline.
| Feature | Ascending | Descending | Symmetrical |
|---|---|---|---|
| Upper trendline | Flat (horizontal) | Declining | Declining |
| Lower trendline | Rising | Flat (horizontal) | Rising |
| Directional bias | Bullish | Bearish | Neutral |
| Typical breakout | Upward | Downward | Either direction |
| Common context | Uptrend continuation | Downtrend continuation | Any trend pause |
The False Breakout Problem and How to Filter It
False breakouts are the single biggest challenge when trading triangle patterns. Price breaks the trendline, triggers your entry, then reverses sharply back inside — leaving you with a loss. Several filters dramatically reduce exposure: wait for the candlestick close rather than an intrabar pierce; avoid entering in the 30–60 minutes before major economic data; check that the breakout aligns with the higher timeframe trend; and require that the breakout candle have meaningful body size. A false breakout does not necessarily mean the pattern has failed — many triangles produce one false break before the real, powerful move develops.

Suggested Image 4: A chart showing a false breakout below a triangle followed by a strong reversal and valid bullish breakout, with both moves labeled.
Alt text: False breakout in forex triangle pattern followed by valid bullish breakout
What Top Traders and Research Say
Thomas Bulkowski’s Encyclopedia of Chart Patterns is the definitive quantitative study of chart patterns. Bulkowski backtested hundreds of ascending, descending, and symmetrical triangles across decades of market data and found that ascending triangles break upward roughly 75% of the time, descending triangles break downward about 64% of the time, and symmetrical triangles break roughly equally in either direction — with the trend context being the most reliable predictor. John J. Murphy’s Technical Analysis of the Financial Markets provides the foundational framework for triangles as continuation and reversal patterns and the clearest explanation of the measured-move method.
In academic research, Lo, Mamaysky, and Wang’s 2000 study “Foundations of Technical Analysis” used automated pattern-recognition algorithms to test whether chart patterns contain statistically significant information about future price movements, and their findings supported the view that technical patterns provide incremental information beyond random price behavior. Veteran analyst Martin Pring offered a concise insight that applies directly: “The trend is your friend until the end when it bends.”
Frequently Asked Questions
What is the best triangle pattern for forex trading?
The ascending triangle is widely considered the most reliable for bullish trades, and the descending triangle for bearish trades, because each carries a built-in directional bias supported by price structure. The ascending triangle forex pattern’s flat resistance and rising lows show clear accumulation, giving the eventual upside forex triangle breakout higher statistical backing compared to the neutral symmetrical triangle. All three can produce excellent trades when properly identified and placed within the correct trend context.
How do I avoid false breakouts?
The most effective filter is to require a full candlestick close beyond the trendline rather than entering on an intrabar pierce. Additionally, avoid trading breakouts immediately before major news releases, check that the breakout direction aligns with the higher timeframe trend, and look for a bold, full-bodied breakout candle. Position-sizing conservatively on the initial entry and adding only on a confirmed retest also limits damage when a false breakout occurs.
How do I calculate the price target for a triangle breakout?
Use the measured-move method. Measure the vertical height of the triangle at its widest point, then project that same distance from the breakout point in the direction of the break. For example, a triangle 200 pips tall produces a minimum target of 200 pips beyond the breakout level. Always check whether that target coincides with a major support/resistance zone and adjust accordingly.
Where should I place my stop-loss?
On a bullish forex triangle breakout, place your stop below the last higher low within the pattern. On a bearish breakdown, place it above the last lower high. Add a small buffer of 10–20 pips to account for spread and normal retest behavior. Avoid setting stops directly at the breakout trendline, as a natural retest of that level is common.
How long does a triangle pattern take to develop?
Triangle patterns typically take several weeks to several months on the Daily and Weekly charts, and several hours to several days on the H4 chart. Patterns that develop over a longer period tend to produce more powerful breakouts because more trapped positions accumulate. Very short-duration triangles on low timeframes are less reliable and more prone to false breakouts.
Can a triangle pattern fail in forex?
Yes. Triangle patterns fail when price breaks out convincingly but then reverses sharply and closes back inside the pattern. Bulkowski’s research found failure rates of roughly 11–17% for ascending and descending triangles depending on conditions. Proper stop-loss placement ensures a failed pattern produces a manageable loss rather than a catastrophic one.
Final Thoughts
The forex triangle pattern strategy offers traders a structured, logical framework for identifying moments when market indecision is about to resolve into a directional move. By learning to distinguish between the bullish bias of the ascending triangle forex, the bearish bias of the descending triangle, and the neutral positioning of the symmetrical triangle, you gain the ability to anticipate breakouts with far greater precision than traders who rely on price alone. The measured-move method gives you a clear, objective exit level, while disciplined stop-loss placement keeps your risk firmly defined before you ever enter. Filtering entries with candlestick confirmation, trend alignment, and breakout candle quality dramatically reduces false-breakout losses. Like all technical strategies, triangles require practice — the more you study them on historical charts, the faster your pattern recognition becomes. For in-depth analysis, trading strategies, and the latest insights, visit forexmarkettrendss.com and trade smarter every session.
This article is intended for educational purposes only and does not constitute financial or investment advice. Trading forex carries substantial risk of loss and is not suitable for all investors.