
The forex Elliott wave strategy stands as one of the most powerful and intellectually rich frameworks in technical analysis. Developed by Ralph Nelson Elliott in the 1930s, this method maps crowd psychology onto price charts through a repeating sequence of waves, giving traders a structured way to anticipate market direction before a move unfolds. While many traders rely on lagging indicators, Elliott Wave analysis offers a forward-looking perspective rooted in the natural rhythm of financial markets. Elliott wave forex trading combines price structure, Fibonacci mathematics, and market psychology into a single unified approach. This article covers everything you need to apply this strategy effectively — from the foundational five-wave impulse sequence and ABC corrective patterns to Fibonacci-based trade entries, stop placement, realistic targets, and the most common mistakes that trip up new wave analysts. Whether you are a beginner curious about wave theory or an experienced trader looking to sharpen your forex wave analysis skills, this guide delivers the practical knowledge you need.
Understanding the Foundation: What Is Elliott Wave Theory?
Ralph Nelson Elliott spent years studying stock market data in the 1930s and made a striking discovery — financial markets do not move randomly. Instead, prices trace out consistent, repeating patterns that reflect the shifting emotions of market participants. Elliott published his findings in The Wave Principle in 1938 and later expanded them in Nature’s Law in 1946. His core insight was that crowd psychology moves in predictable cycles of optimism and pessimism, and those cycles leave visible fingerprints on price charts.
The forex Elliott wave strategy is built on this foundation. Every significant price move in a currency pair — whether EUR/USD, GBP/JPY, or AUD/USD — contains within it a fractal structure of waves that nest inside larger waves. A wave at the smallest observable timeframe is also a subcomponent of a wave at a higher timeframe. This fractal quality means the same analytical tools apply whether you are reading a 5-minute chart or a monthly chart.
Elliott’s theory gained its most authoritative modern treatment through A.J. Frost and Robert Prechter’s Elliott Wave Principle: Key to Market Behavior, first published in 1978. That book remains the definitive reference for practitioners worldwide and established the terminology and counting conventions that all serious wave analysts follow today.
The Core Structure: Impulse Waves and Corrective Waves
Elliott wave forex trading revolves around two fundamental types of wave sequences: the impulse (or motive) wave and the corrective wave.
The Five-Wave Impulse Sequence
The impulse wave moves in the direction of the larger trend and consists of five numbered waves. Waves 1, 3, and 5 are themselves impulse moves — they drive the market forward. Waves 2 and 4 are corrective pullbacks against that trend. A complete impulse sequence from start to finish gives traders five clear price swings, labeled 1 through 5.
Each of these waves carries a distinct personality. Wave 1 is often subtle and unconvincing. Wave 2 retraces a large portion of wave 1, which causes latecomers to feel validated in their skepticism. Wave 3 is where the real money is made — it is the strongest, most impulsive move of the sequence, carrying the greatest momentum and volume. Wave 4 pulls back in a choppy, overlapping fashion, offering a second opportunity to enter in the direction of the trend. Wave 5 is the final push, often accompanied by deteriorating momentum and growing public enthusiasm — the hallmark of a market running out of fuel.
The Three-Wave ABC Corrective Sequence
After a five-wave impulse completes, the market corrects the entire move in a three-wave sequence labeled A, B, and C. Wave A moves against the prior trend, wave B partially retraces that move, and wave C completes the correction — usually matching or exceeding the length of wave A. Together, the five-wave impulse and the three-wave correction form the complete 5-3 wave pattern that is the backbone of forex wave analysis.
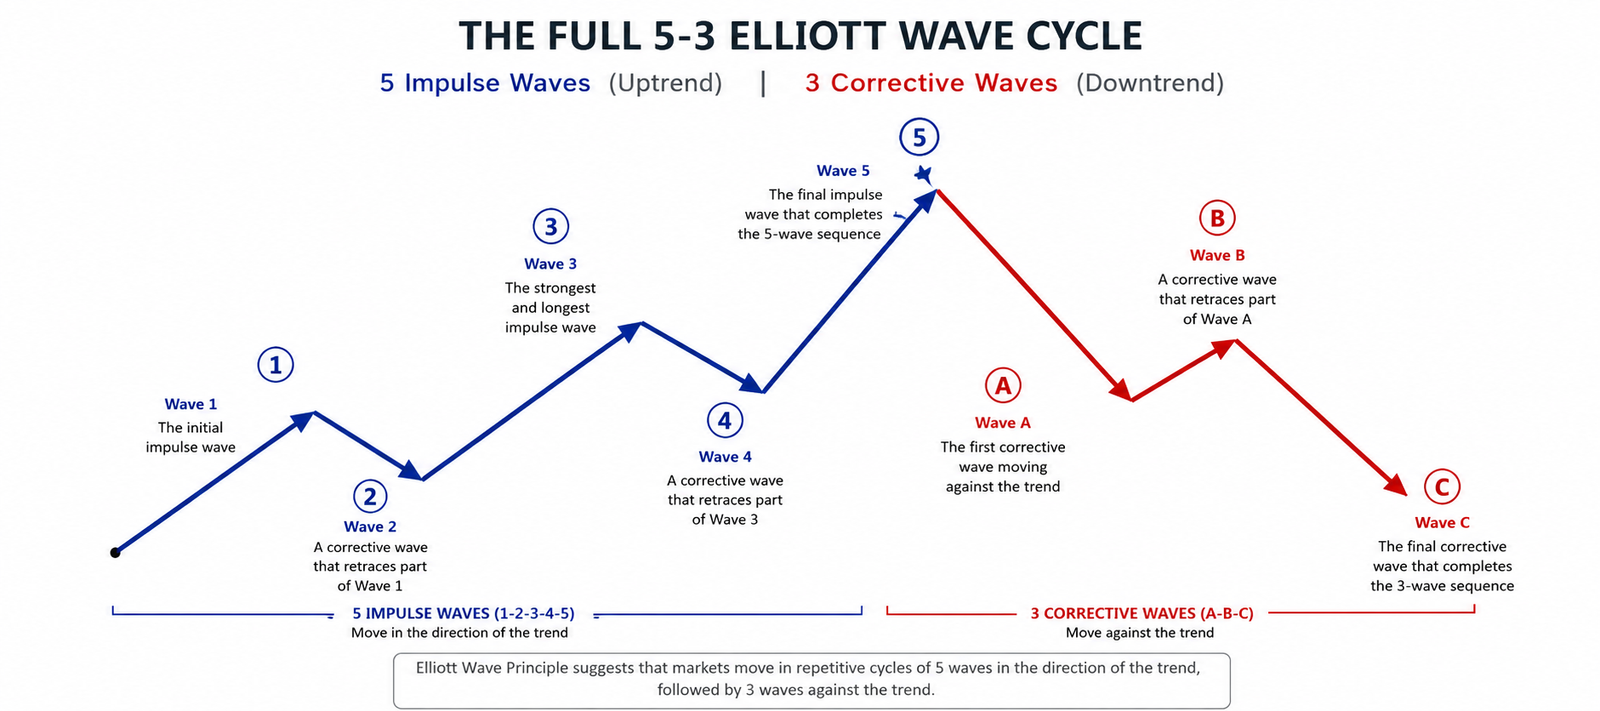
Fig 1.1 Forex Elliott wave strategy
The Three Unbreakable Rules of Elliott Wave
Unlike many concepts in technical analysis, the Elliott wave rules are absolute. If a wave count violates any of the three core rules, the count is wrong and must be revised. These rules are not guidelines — they are structural requirements.
Rule One: Wave 2 can never retrace 100% or more of wave 1. If wave 2 falls below the origin of wave 1, the market is not in a wave 2 — the count is incorrect. This rule protects traders from mislabeling a continuation of the previous trend as a new impulse.
Rule Two: Wave 3 can never be the shortest impulse wave (waves 1, 3, and 5) in the sequence. In practice, wave 3 is almost always the longest and most extended of the three motive waves.
Rule Three: Wave 4 cannot overlap the price territory of wave 1. Specifically, the low of wave 4 (in an uptrend) cannot fall below the high of wave 1. When overlap occurs, traders should consider diagonal triangle patterns, which are the one exception to this rule.
Fibonacci Ratios: The Mathematical Partner to Elliott Wave
Ralph Nelson Elliott himself recognized that Fibonacci mathematics underpinned the wave patterns he observed. The golden ratio — 1.618 and its inverse 0.618 — appears consistently in the relationships between waves in both length and time. Fibonacci Elliott wave analysis provides traders with specific price levels at which waves are likely to end and reverse.
| Wave | Common Fibonacci Relationship |
|---|---|
| Wave 2 | Typically retraces 50%, 61.8%, or 76.4% of wave 1 |
| Wave 3 | Often extends to 161.8%, 200%, or 261.8% of wave 1 |
| Wave 4 | Typically retraces 38.2% or 50% of wave 3 |
| Wave 5 | Often equals wave 1, or extends to 61.8% of waves 1+3 |
| Wave B | Typically retraces 38.2%, 50%, or 61.8% of wave A |
| Wave C | Often equals wave A, or extends to 161.8% of wave A |
These ratios are not magic — they are probabilistic targets that narrow the field of possible outcomes. When a wave retraces exactly to the 61.8% level and holds, combined with a valid wave count and supportive momentum, traders have a high-probability setup to act on.
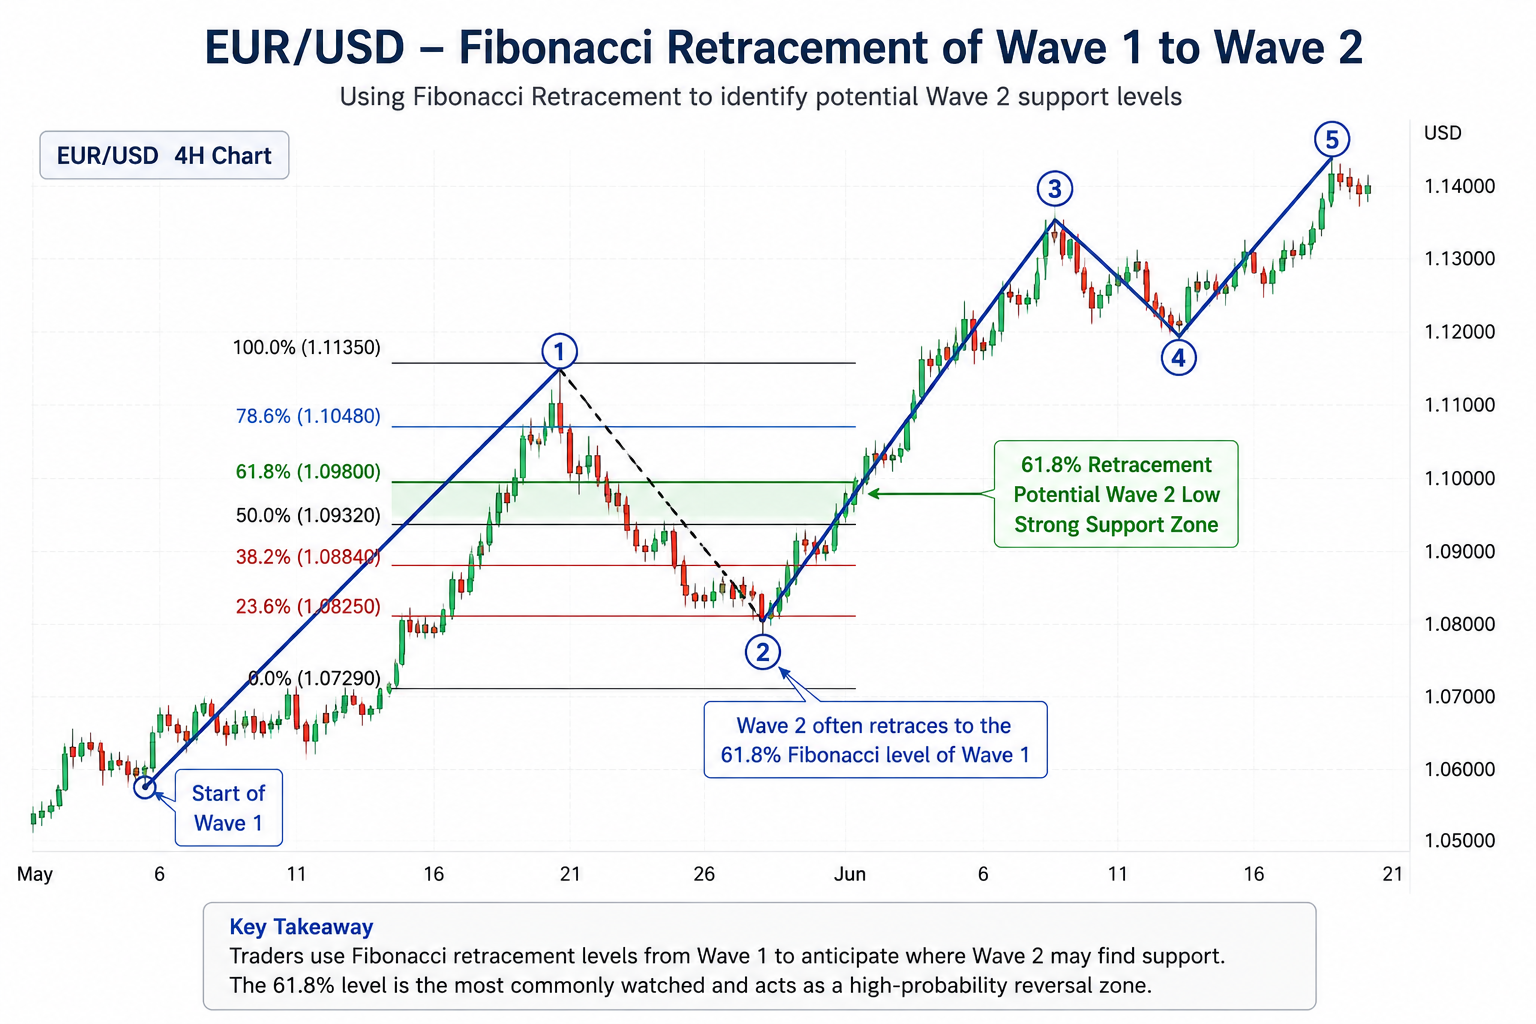
Fig 1.2 Elliott wave Fibonacci retracement
How to Trade the Forex Elliott Wave Strategy: A Step-by-Step Approach
Applying the forex Elliott wave strategy in live markets requires discipline, practice, and a systematic process. Begin with the daily or 4-hour chart and determine the direction of the dominant trend, looking for a completed ABC correction on the larger degree that often marks the start of the next impulse sequence.
Next, move to the 4-hour or 1-hour chart and label the current wave count from the most recent obvious swing high or low. The best wave analysts maintain a primary count and one or two alternate counts. The two best entry points are the end of wave 2 (to enter wave 3) and the end of wave 4 (to enter wave 5). Wave 3 entries are the most lucrative because wave 3 is typically the longest and fastest wave.
The Elliott wave rules define natural stop placement. For a wave 2 long entry, the stop goes below the origin of wave 1; a violation invalidates the count. Project the likely end of wave 3 using Fibonacci extensions of wave 1 — the 161.8% extension is the most common target. For wave 5, measure the total length of waves 1 through 3 and apply the 61.8% extension to project the target.
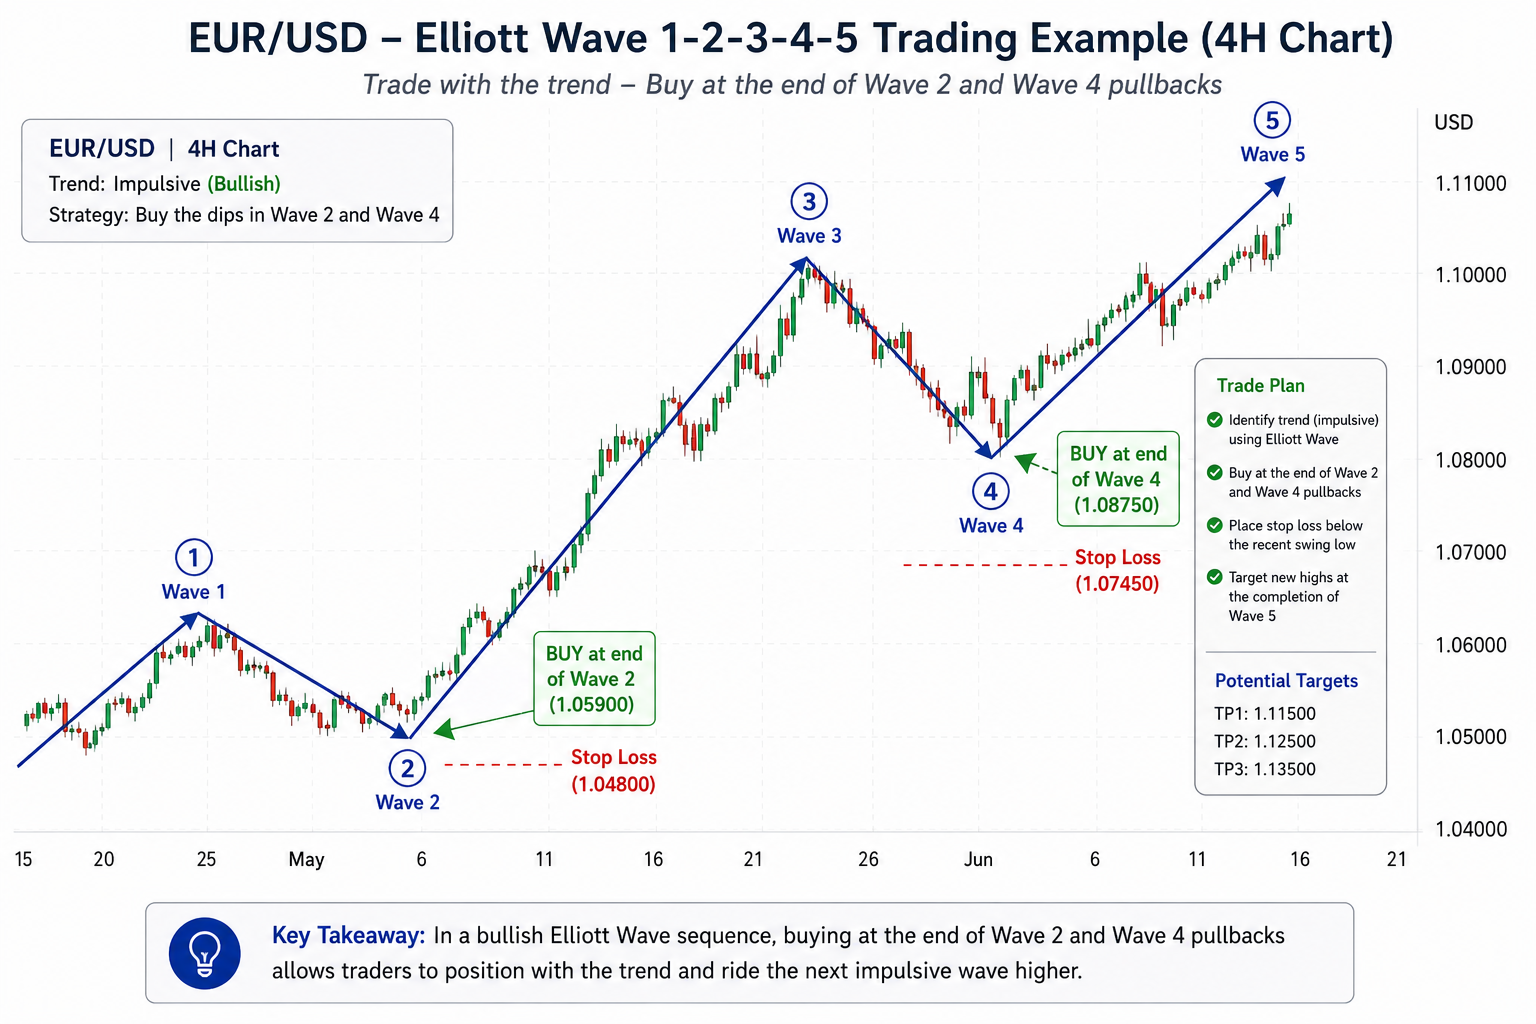
Fig 1.3 Elliott wave forex trading
The Subjectivity Problem and Common Criticisms
The most common and legitimate criticism of Elliott wave forex trading is its inherent subjectivity. Two experienced analysts can look at the same chart and arrive at different wave counts, each logically consistent with the rules. This happens because the market rarely produces textbook-perfect waves.
Academic research has produced mixed results on technical analysis broadly. Andrew Lo, Harry Mamaysky, and Jiang Wang’s influential 2000 paper “Foundations of Technical Analysis” found that certain technical patterns do contain statistically significant information — a qualified endorsement of the field. The practical solution is to treat wave counts as probabilistic frameworks rather than certainties, define what price action would invalidate a count, and honor those invalidation levels with disciplined stop placement.
New practitioners consistently make several identifiable errors: forcing a count onto price action that does not fit, ignoring the three core rules, focusing on a single timeframe without higher-timeframe context, and using Elliott Wave in isolation without Fibonacci levels or momentum confirmation. The strategy works best as a framework that coordinates with other confirming tools.
What Top Traders and Research Say
The intellectual foundation of modern Elliott Wave practice rests on two essential books. A.J. Frost and Robert Prechter’s Elliott Wave Principle: Key to Market Behavior (1978) is the gold standard reference, presenting the complete theory with annotated market examples across decades. John Murphy’s Technical Analysis of the Financial Markets provides excellent context for Elliott Wave within the broader technical analysis landscape.
On the research side, Andrew Lo, Harry Mamaysky, and Jiang Wang’s 2000 study in The Journal of Finance, “Foundations of Technical Analysis,” represents the most rigorous academic examination of technical patterns and concludes that technical analysis does provide incremental information beyond random price movement.
Legendary trader Paul Tudor Jones, who has publicly discussed wave-based analysis, captured the underlying philosophy simply: “The secret to being successful is having a view.” The forex Elliott wave strategy provides precisely that — a structured, rule-bound view of where the market is likely to head next, built on the observable psychology of crowd behavior rather than gut feeling.
Frequently Asked Questions
What are the three rules of Elliott Wave Theory, and why do they matter?
The three core rules are: wave 2 cannot retrace 100% or more of wave 1; wave 3 cannot be the shortest of the three impulse waves; and wave 4 cannot enter the price territory of wave 1. They matter because they are the only absolute boundaries in wave analysis. For traders using the forex Elliott wave strategy, these rules also define natural stop-loss levels — a violation signals the trade premise is invalidated and it is time to exit.
How do Fibonacci ratios fit into Elliott wave forex trading?
Fibonacci ratios are the mathematical backbone of Elliott wave forex trading. Wave 2 typically retraces 50%–61.8% of wave 1, wave 3 commonly extends to 161.8% of wave 1, and wave 4 often retraces 38.2%–50% of wave 3. These levels create specific price zones where traders anticipate reversals, providing objective entry points and profit targets rather than arbitrary levels.
Which wave offers the best trading opportunity?
Wave 3 is universally considered the most tradeable wave because it is the strongest, longest, and most momentum-driven move in the sequence. Entering at the end of wave 2 — when the market has pulled back to its 50%–61.8% retracement zone and begins showing reversal signals — positions a trader to capture the bulk of wave 3 with a tightly defined stop just below wave 1’s origin.
Is Elliott Wave Theory reliable for forex markets?
The forex Elliott wave strategy is a powerful analytical tool, but reliability depends on how it is used. Elliott Wave analysis is inherently probabilistic. When wave counts are combined with Fibonacci levels, momentum indicators, and multi-timeframe confirmation, the method’s accuracy improves meaningfully. The professional response to its subjectivity is to maintain clear invalidation levels and honor them with disciplined stops.
What is the difference between a zigzag and a flat correction?
A zigzag correction is a sharp, deep move with a 5-3-5 internal structure that often retraces 50%–78.6% of the prior impulse. A flat correction has a 3-3-5 structure and is shallower and choppier, with wave C ending near or slightly beyond wave A’s end. Identifying which corrective type is forming helps traders set more accurate targets for when the correction will end.
How do you handle alternate wave counts when trading?
Professionals maintain a primary count — the interpretation that best fits the rules, Fibonacci relationships, and momentum — and one or two alternate counts that are possible but less likely. The primary count drives the trade decision, while alternates define the scenarios under which it fails. This converts the subjectivity of wave analysis into a risk management advantage.
Final Thoughts
The forex Elliott wave strategy is one of the most comprehensive approaches to understanding financial markets ever developed. Rooted in Ralph Nelson Elliott’s observation that human psychology creates fractal price patterns, this framework gives traders a structured way to anticipate trend direction, identify high-probability entry zones, and place logical stops and targets based on the geometry of the market itself. Mastering Elliott wave forex trading takes time, but the reward is a methodology that blends crowd psychology, mathematical proportion, and multi-timeframe analysis into a single coherent strategy. Combining wave analysis with momentum indicators and disciplined risk management transforms this theory into a practical edge. For more expert forex analysis and wave count breakdowns, visit forexmarkettrendss.com and follow the regular updates that keep you informed in every market condition.