
Introduction
If you have ever watched a clean trend run for hundreds of pips while you sat frozen, unsure whether to enter, you already understand why forex trend indicators matter so much. These tools turn raw price chaos into a readable story, helping you see direction, momentum, and exhaustion before the crowd reacts. In this guide we move past hype and break down the indicators that working traders genuinely rely on, from classic Moving Averages to MACD, ADX/DMI, the Ichimoku Kumo, Parabolic SAR, Supertrend, and moving average ribbons. You will also learn how to perform a safe forex indicators download, install custom tools on MetaTrader, and tell a quality free forex indicator apart from a repainting trap. By the end, you will have a practical framework for choosing, combining, and trusting the trend signals that fit your own style and timeframe.
Why Trend Indicators Matter More Than Signals
The most expensive mistake new traders make is hunting for a magic signal that prints “buy” or “sell” arrows. Markets do not work that way, and any tool promising certainty is selling you a story. What forex trend indicators actually provide is context: they tell you whether the market is trending or ranging, how strong the move is, and where momentum may be fading. That context is what separates a disciplined trader from a gambler reacting to every candle. When you know the trend is strong and intact, you can hold a winner instead of panic-closing it at the first pullback, and you can avoid fighting a freight train by shorting into strength.
Trend tools also impose structure on your decisions. Instead of asking “does this feel like it’s going up?” you ask measurable questions: is price above the moving average, is ADX above 25, is the MACD histogram expanding? These objective checks reduce emotional noise and make your strategy testable. A rule you can write down is a rule you can backtest, refine, and trust. That is the real value here, and it is why the indicators below have survived decades of market evolution while countless gimmicks vanished.
Moving Averages: The Foundation of Trend Trading
No discussion of trend tools begins anywhere but Moving Averages, the bedrock on which most other indicators are built. A simple moving average (SMA) smooths price by averaging the last N closes, while an exponential moving average (EMA) weights recent prices more heavily, reacting faster to fresh moves. Traders use them in three main ways: as a directional filter (price above a rising 200 EMA suggests an uptrend), as dynamic support and resistance, and as crossover signals where a faster average crossing a slower one hints at a shift. The famous “golden cross” (50 over 200) and “death cross” capture long-term regime changes that even mainstream financial media report on.
Settings are personal, but a few combinations have stood the test of time. Many swing traders watch the 50 and 200 EMA on the daily chart, while intraday traders often favor the 20 EMA as a momentum guide and the 9 EMA for fast scalps. The key is consistency: pick a set, learn its rhythm on your pairs, and stop second-guessing. Because Moving Averages lag price by design, they confirm trends rather than predict them, which is a strength when used as a filter and a weakness when used alone in choppy conditions. Pairing them with a momentum tool, as we will see, covers that blind spot neatly.
MACD: Reading Momentum Behind the Trend
The Moving Average Convergence Divergence, or MACD, takes the moving average concept and turns it into a momentum oscillator. It subtracts a 26 EMA from a 12 EMA to form the MACD line, then plots a 9 EMA of that line as the signal line, with the gap between them drawn as a histogram. When the MACD line crosses above the signal line and the histogram flips positive, bullish momentum is building; the reverse warns of fading strength. Because MACD sits below the chart, it is easy to read at a glance, which is why it remains one of the most popular tools on MetaTrader and TradingView alike.
Where MACD earns its keep is divergence. When price prints a higher high but MACD prints a lower high, the trend is losing fuel even if it has not yet reversed, a heads-up that lets you tighten stops or take partial profit. Used together with a moving average filter, MACD becomes a timing layer: the average tells you the trend direction, and MACD tells you when momentum agrees. Traders should remember it is still a lagging tool derived from moving averages, so it works best in trending markets and produces whipsaws in tight ranges. Respecting that limitation is the difference between MACD being a sharp instrument and a source of frustration.
ADX and DMI: Measuring Trend Strength
Knowing the direction of a trend is only half the picture; you also need to know whether the trend has any conviction. That is the job of the Average Directional Index (ADX) and its companions, the Directional Movement Indicators (+DI and -DI), developed by Welles Wilder. ADX itself is non-directional: it rises as a trend strengthens regardless of whether price is climbing or falling, and it falls as the market loses momentum and drifts sideways. A common reading is that ADX below 20 signals a weak or ranging market where trend strategies struggle, while readings above 25 confirm a trend worth following, and values above 40 suggest a powerful, possibly stretched move.
The +DI and -DI lines add the directional layer ADX deliberately omits. When +DI is above -DI, buyers are in control; when -DI dominates, sellers are. Many traders use a simple combined rule: take long signals only when +DI is above -DI and ADX is rising above 25, which filters out the low-conviction chop that destroys trend systems. This makes ADX/DMI less of a standalone entry tool and more of a quality filter that decides whether your other signals deserve attention. In ranges it keeps you out of trouble; in trends it gives you the confidence to stay in. That filtering role is exactly why professionals keep it on the chart even when they trade primarily by price action.
Ichimoku Kumo: An All-in-One Trend System
The Ichimoku Kinko Hyo, often reduced to its signature “Kumo” or cloud, is a complete trend system disguised as a single indicator. Developed in Japan and refined over decades, it plots several lines at once: the Tenkan-sen and Kijun-sen as fast and slow baselines, the Chikou span as a lagging confirmation, and two leading spans that form the shaded cloud. The cloud is the heart of it. When price trades above a rising green Kumo, the trend is bullish and the cloud acts as support; when price sits below a falling red cloud, bears are in command. A thick cloud signals strong, hard-to-break trend conditions, while a thin one warns of fragility.
What makes the Ichimoku Kumo appealing is that it answers direction, support, resistance, and momentum in one glance, without cluttering the screen with five separate windows. Traders look for price breaking through the cloud, the Tenkan crossing the Kijun, and the Chikou span clear of past price for high-conviction setups. The trade-off is a learning curve: the chart looks intimidating at first, and beginners often misread the leading spans. Yet once internalized, many swing and position traders find the Kumo becomes the only trend framework they need, precisely because it bundles so much information into a coherent, rule-based picture rather than a pile of disconnected indicators.
Parabolic SAR, Supertrend, and Moving Average Ribbons
Three more tools round out a serious trend toolkit, each solving a specific problem. The Parabolic SAR, another Wilder creation, plots dots above or below price that flip sides when the trend reverses, making it a natural trailing-stop and exit guide. Its strength is clarity in strong trends, where the dots ride the move and tell you exactly where to trail your stop; its weakness is constant flip-flopping in sideways markets, so it is best paired with a strength filter like ADX. Used as an exit rather than an entry tool, SAR keeps you in winners and gets you out before deep reversals.
The Supertrend indicator has surged in popularity for good reason: built on the Average True Range, it overlays a single colored line that turns green in uptrends and red in downtrends, offering an intuitive trend-following filter and dynamic stop level. Many traders pair it with EMAs for confirmation. Finally, moving average ribbons stack a series of EMAs (for example 8, 13, 21, 34, 55) so that the spacing and order of the lines reveal trend health at a glance. When the ribbon is fanned out and neatly stacked, the trend is strong and orderly; when the lines compress and tangle, momentum is stalling and a transition may be near. Together these three turn abstract trend ideas into visual, actionable signals.
Comparing the Best Forex Trend Indicators
Choosing among these tools is easier when you see their trade-offs side by side. The table below summarizes how the leading forex trend indicators behave so you can match them to your timeframe and temperament. Remember that none of these costs anything to use on MetaTrader; the built-ins are free, and a quality free forex indicator for the custom ones is widely available.
| Indicator | Best Use | Type | Lag | Difficulty |
|---|---|---|---|---|
| Moving Averages | Trend direction & filter | Lagging | Medium | Easy |
| MACD | Momentum & divergence | Lagging | Medium | Easy |
| ADX / DMI | Trend strength filter | Lagging | Medium | Moderate |
| Ichimoku Kumo | All-in-one trend system | Mixed | Low-Med | Hard |
| Parabolic SAR | Trailing stop / exits | Lagging | Low | Easy |
| Supertrend | Trend filter & stop | Lagging | Low-Med | Easy |
| MA Ribbon | Visual trend health | Lagging | Medium | Easy |
The clear takeaway is that no single tool wins outright. Moving Averages and Supertrend give you clean direction, MACD adds momentum, ADX confirms strength, SAR manages exits, and the Ichimoku Kumo bundles much of it together. The art lies in combining two or three complementary tools without drowning your chart in redundant signals.
How to Download and Install Free Forex Indicators on MT4/MT5
The built-in indicators above ship free with every MetaTrader installation, found under the Insert and Navigator menus, so for most traders no download is even necessary. When you do want a custom tool such as a particular Supertrend or ribbon variant, a careful forex indicators download matters. Always source files from reputable communities and the official MetaTrader codebase rather than random pop-up sites, because indicator files can carry risky code. A legitimate free forex indicator comes as an ex4 or mq4 file for MT4, or ex5/mq5 for MT5, and should never demand strange permissions or upfront payment to “unlock signals.”
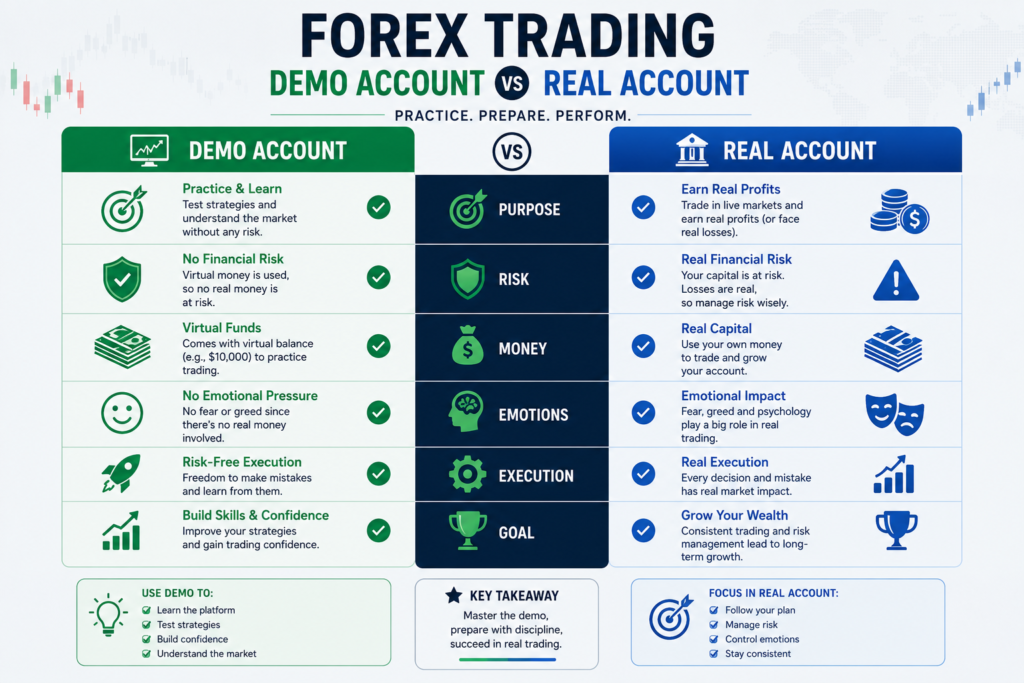
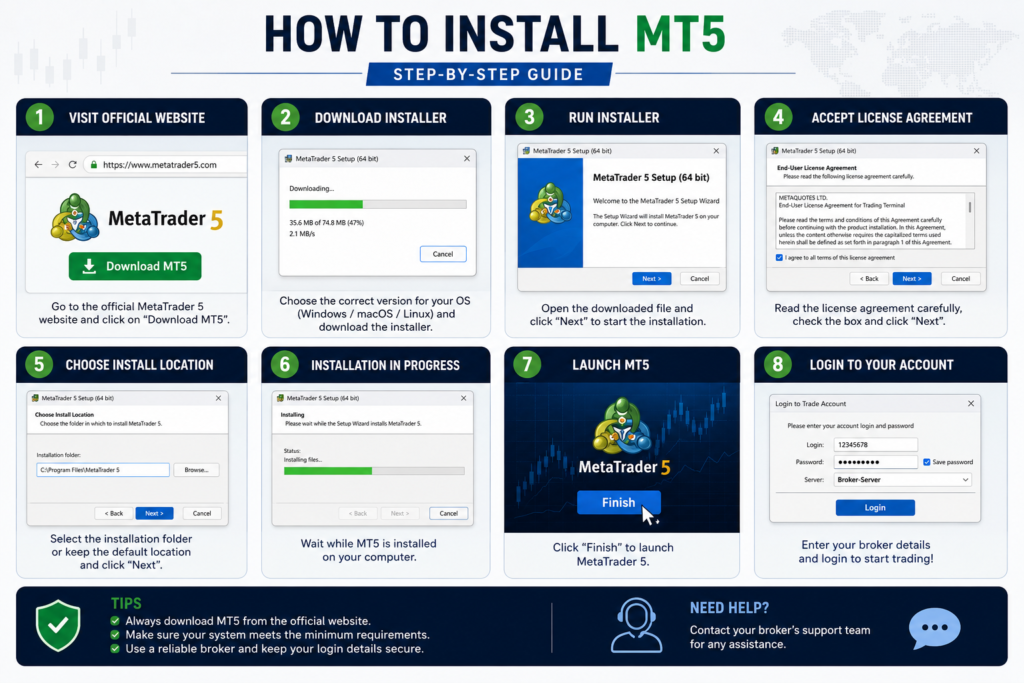
Installation is straightforward once you have a trusted file. In MetaTrader, open File, then Open Data Folder, navigate into the MQL4 or MQL5 folder, and drop the indicator into the Indicators subfolder. Restart the platform or refresh the Navigator panel, and the new tool appears ready to drag onto any chart. Before risking real money, attach it on a demo account and run it through the Strategy Tester to see how it behaves across different market conditions. Crucially, beware of any indicator that “repaints,” meaning it redraws past signals to look perfect in hindsight while failing live. The short bullet list below captures the non-negotiable checks for any custom tool.
- Source from trusted, well-reviewed communities, not anonymous ad-heavy sites
- Confirm correct file type (ex4/mq4 for MT4, ex5/mq5 for MT5) and scan it
- Test on demo first and verify it does not repaint past signals
What Top Traders and Research Say
The case for trend tools is not just folklore; it has serious literature behind it. John Murphy’s classic *Technical Analysis of the Financial Markets* remains the standard reference for understanding how moving averages, MACD, and directional indicators are constructed and applied, and it is widely recommended as a starting point for any serious trader. On the academic side, the well-known study by Brock, Lakonishok, and LeBaron (1992) tested simple moving average rules on long-run market data and found they carried predictive value that was difficult to dismiss as random, a finding that helped legitimize trend-following research. Later work, including Lo, Mamaysky, and Wang (2000), “Foundations of Technical Analysis,” brought rigorous statistical methods to chart patterns and concluded that several technical indicators do convey incremental information.
None of this guarantees profit, and every responsible author stresses that indicators are tools, not crystal balls. As Paul Tudor Jones is often quoted, “The secret to being successful is to have great defense, not great offense.” That sentiment captures why trend indicators earn their place: they are most powerful not for picking perfect entries but for keeping you aligned with the dominant move and disciplined about exits.
FAQs
Which is the best forex trend indicator for beginners?
For most beginners, Moving Averages are the ideal starting point among forex trend indicators because they are simple, visual, and easy to interpret. A 50 and 200 EMA on the daily chart quickly shows you the dominant direction. Once comfortable, adding MACD for momentum or Supertrend for a clean trend filter builds a solid, uncluttered system without overwhelming your screen.
Are free forex indicators safe to download and use?
A reputable free forex indicator can be perfectly safe, especially the built-in tools that already ship with MetaTrader. The risk comes from custom files sourced from untrustworthy sites. Always perform your forex indicators download from well-reviewed communities, scan the file, and test it on a demo account first. Avoid anything that demands payment to unlock signals or that secretly repaints.
What does it mean when an indicator repaints?
Repainting means an indicator changes or redraws its past signals after the fact, making historical results look far better than they really were. A repainting tool might show perfect entries on old candles that never actually existed in real time. This is why testing on a live demo matters: a genuinely useful indicator keeps its past signals fixed and honest.
Can I rely on a single trend indicator?
Relying on one indicator alone is rarely wise, since every tool has blind spots. Moving Averages confirm direction but lag, MACD reads momentum but whipsaws in ranges, and ADX measures strength without direction. Combining two or three complementary forex trend indicators, such as an EMA filter with ADX confirmation, produces far more reliable signals than any single tool used in isolation.
Do trend indicators work on all timeframes?
Yes, the same indicators apply from the one-minute scalping chart to the weekly position chart, though settings and behavior change with timeframe. Lower timeframes produce more signals and more noise, while higher timeframes give slower but cleaner trends. Many traders use a multi-timeframe approach, confirming the higher-timeframe trend before taking entries on a lower one.
Final Thoughts
Trend indicators will never hand you a guaranteed win, but used well they transform trading from anxious guesswork into a structured, repeatable process. The strongest approach is rarely about finding one perfect tool; it is about combining a direction filter like Moving Averages or Supertrend, a momentum reader like MACD, and a strength gauge like ADX, then layering in the Ichimoku Kumo, Parabolic SAR, or a moving average ribbon as your style demands. Pair that with a careful forex indicators download habit, a healthy distrust of repainting tools, and disciplined testing on demo, and you have a foundation that serves you across every market condition. The best forex trend indicators reward patience and consistency far more than constant tinkering.