
Few tools divide opinion quite like the Fibonacci retracement, yet few are used by so many traders around the world. A forex Fibonacci strategy uses a sequence of ratios derived from nature and mathematics to anticipate where a pullback within a trend is likely to end, giving you precise, repeatable entry zones. This guide explains what the tool is, why those levels matter, how to draw and trade them, and how confluence and risk management turn a set of lines on a chart into a genuine, disciplined trading edge.
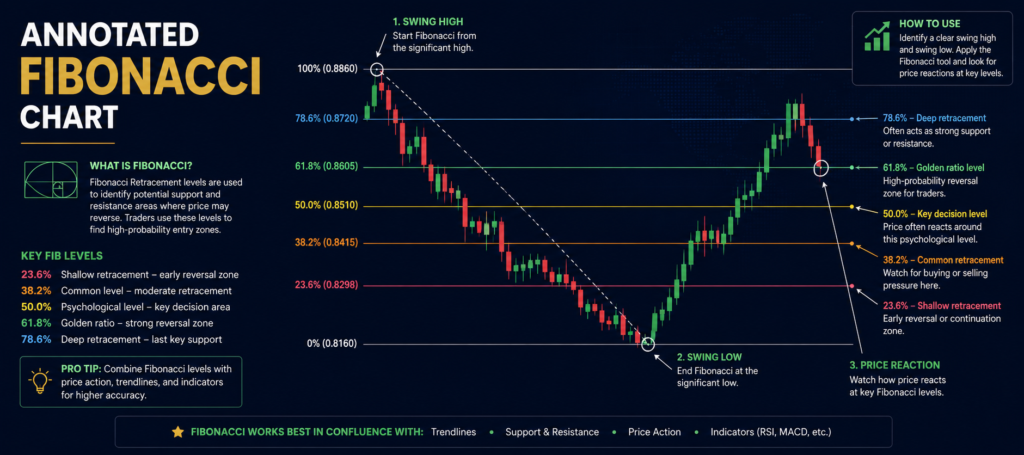
Fig 1.1 Forex Fibonacci strategy
What Is a Forex Fibonacci Strategy?
A forex Fibonacci strategy uses horizontal levels derived from the famous Fibonacci sequence to identify where a pullback within a trend is likely to find support or resistance before the trend resumes. Rather than guessing how deep a retracement will run, the trader plots a grid of key ratios across a recent move and watches for price to react at one of them.
The core idea rests on a simple observation about how markets move. Trends rarely advance in a straight line; they surge, pull back as early profit-takers exit, and then resume. The Fibonacci retracement tool attempts to measure those pullbacks, suggesting the specific zones where the counter-move is most likely to exhaust itself and the dominant trend is most likely to reassert control.
Crucially, a Fibonacci strategy is not a standalone system but a precision tool that works best within a trend. You first establish the direction with trend analysis, then use the Fibonacci levels to time a high-probability entry on the pullback. Used this way, Fibonacci retracement forex trading combines the big-picture edge of trend following with the sniper-like entry timing that the ratios provide.
Why Fibonacci Levels Matter
The forex Fibonacci levels that traders watch most closely are derived from the mathematical relationships within the Fibonacci sequence, producing ratios such as 38.2 percent, 50 percent, and the so-called golden ratio of 61.8 percent. These percentages mark how far a pullback has retraced the prior move, and price has a well-documented tendency to react around them.
There is genuine debate about why these levels work, and the most honest answer combines two explanations. The first is that the ratios may reflect natural proportions that appear throughout nature and human behaviour. The second, and arguably more important, is that the levels are partly self-fulfilling: because so many traders around the world watch the same Fibonacci levels and place orders around them, their collective behaviour creates real support and resistance at those zones.
Whichever explanation you favour, the practical takeaway is the same. The Fibonacci levels concentrate trader attention and order flow, and concentrated order flow is exactly what creates the reactions a trader can exploit. The 50 percent and 61.8 percent levels tend to be the most closely watched, marking the zone where a healthy pullback often ends and the trend resumes, which is why they form the heart of most Fibonacci entry strategies.
How to Draw and Trade Fibonacci Levels
Trading Fibonacci well begins with drawing it correctly, which is simpler than many beginners fear. You identify a clear, completed price swing within the prevailing trend, then attach the Fibonacci tool from the start of the move to its end, in an uptrend from the swing low to the swing high. The tool then automatically plots the retracement levels across the pullback that follows.
With the grid in place, you wait for price to retrace into the key zone, typically between the 50 percent and 61.8 percent levels, and you watch for confirmation rather than entering blindly. The strongest setups appear when a Fibonacci level coincides with another form of support, such as a moving average, a prior structure level, or a bullish candlestick pattern. This confluence dramatically improves the odds compared with trading the level in isolation.
Once price reacts at the level with a confirming signal, you enter in the direction of the trend, place your stop just beyond the next Fibonacci level or the recent swing point, and target the prior high or a Fibonacci extension. The table below summarises the key levels and how traders typically use them.
| Level | Common Interpretation |
|---|---|
| 38.2% | Shallow pullback, strong trend |
| 50% | Common, closely watched midpoint |
| 61.8% | Golden ratio, deep but valid pullback |
| 78.6% | Last-chance level before trend doubt |
| Extensions (127.2%, 161.8%) | Profit targets beyond the prior move |
A retracement deeper than 78.6 percent often signals that the trend may be failing rather than merely pausing, which is a useful warning to stand aside.
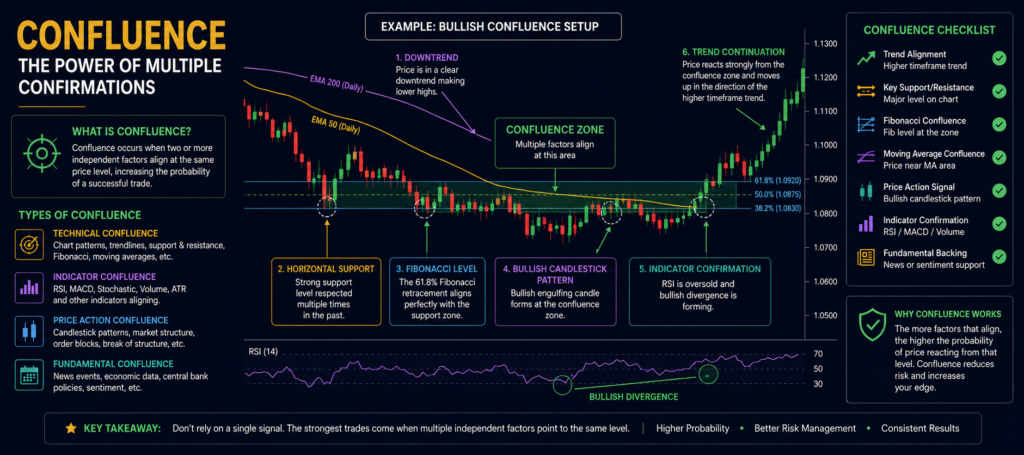
Fig 1.2 Fibonacci retracement forex confluence
What Top Traders and Research Say About Fibonacci
Fibonacci trading has earned both devoted followers and sharp critics, and the truth lies somewhere in between. Carolyn Boroden, whose book Fibonacci Trading is a respected reference on the subject, emphasises that the real edge comes not from any single line but from clusters where multiple Fibonacci relationships converge on the same price zone. Her approach treats Fibonacci as a tool for finding high-probability confluence rather than magic numbers that work in isolation.
Academic research offers measured support for the broader family of technical methods. The influential study “Foundations of Technical Analysis” by Andrew Lo, Harry Mamaysky, and Jiang Wang found that several common technical patterns carry genuine, measurable informational value, lending credibility to disciplined, rules-based technical trading even as it stops short of endorsing any specific tool. The honest position is that Fibonacci works best as one input among several, and partly because so many believe in it.
The trader Paul Tudor Jones captured the discipline that any Fibonacci strategy demands: “Where you want to be is always in control, never wishing, always trading.” For a Fibonacci trader, that means treating each level as a decision point with a predefined plan, not a hope, entering only on confirmation and exiting on a clear stop, so that the precision of the levels is matched by the precision of the execution.
Common Fibonacci Mistakes
The most common error is treating Fibonacci levels as guarantees rather than zones of probability. Price frequently overshoots or undershoots a level slightly, so traders who place orders to the exact pip are often stopped out by normal noise. Treating each level as a small zone, and waiting for a confirming reaction, avoids this trap.
A second mistake is using Fibonacci against the trend or in a directionless market, where the levels lose much of their meaning. Fibonacci is a tool for timing pullback entries within a trend, not a reversal-prediction machine. Drawing the tool from the wrong swing points is another frequent error that produces meaningless levels. Finally, abandoning risk management because a level “looks certain” is dangerous; no level is certain, so a logical stop and sensible position size remain non-negotiable on every Fibonacci trade.
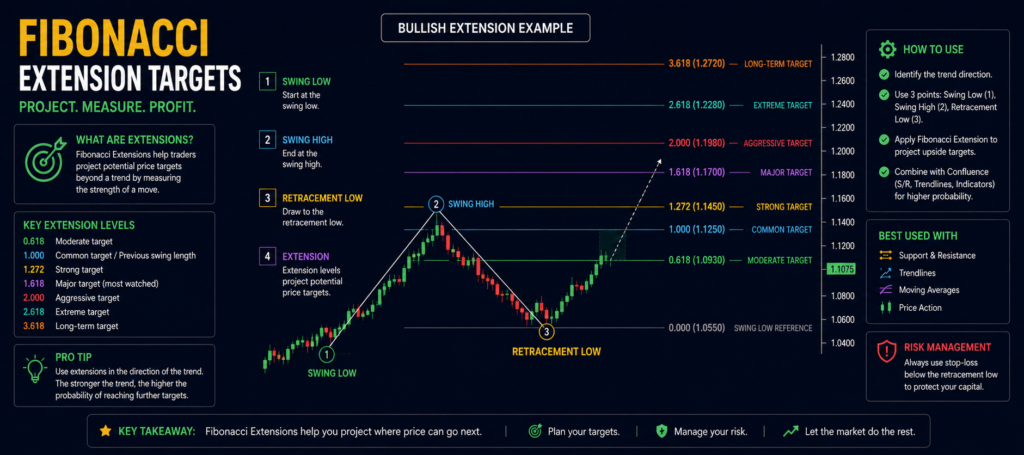
Fig 1.3 Forex Fibonacci strategy profit targets
Frequently Asked Questions
What is a forex Fibonacci strategy?
A forex Fibonacci strategy uses retracement levels derived from the Fibonacci sequence to identify where a pullback within a trend is likely to end before the trend resumes. You draw the tool across a clear price swing, then wait for price to react at a key level such as 50 or 61.8 percent. It works best within a trend and alongside confirmation, combining trend-following direction with precise, repeatable entry timing rather than guesswork.
What are the most important Fibonacci retracement levels?
The most closely watched forex Fibonacci levels are 38.2 percent, 50 percent, and the golden ratio of 61.8 percent. A shallow 38.2 percent pullback suggests a very strong trend, while the 50 to 61.8 percent zone marks the most common area where healthy pullbacks end. The 78.6 percent level is the last-chance zone before the trend comes into doubt. Extension levels such as 127.2 and 161.8 percent serve as profit targets beyond the prior move.
Does Fibonacci retracement actually work in forex?
Fibonacci retracement forex trading works partly because the levels concentrate trader attention and order flow, making them at least somewhat self-fulfilling, and partly as one useful input among several. It is not a magic predictor, and price often reacts near rather than exactly at a level. Research on technical patterns lends measured support to disciplined technical trading. The honest view is that Fibonacci is most reliable when combined with trend analysis and confluence rather than used alone.
How do I draw Fibonacci correctly?
Identify a clear, completed price swing in the direction of the trend, then attach the Fibonacci tool from the start of that move to its end, in an uptrend from the swing low to the swing high. The tool plots the retracement levels across the pullback that follows. Drawing from the wrong swing points produces meaningless levels, so choose obvious, significant swings on a higher timeframe and treat each level as a small zone rather than an exact line.
How do I combine Fibonacci with other tools?
The strongest Fibonacci setups occur at confluence, where a level aligns with another form of support or resistance, such as a moving average, a prior structure level, or a candlestick pattern. Trading only in the direction of the trend adds a further edge. This layering, rather than relying on a single line, is exactly what experienced Fibonacci traders emphasise, because concentrated, overlapping signals produce far higher-probability entries than any one tool used in isolation.
What timeframe is best for Fibonacci trading?
Higher timeframes such as the four-hour and daily charts produce cleaner, more reliable Fibonacci levels because the swings are more significant and watched by more traders. Lower timeframes offer more setups but more noise and false reactions. Beginners should start on higher timeframes to build confidence. Whatever timeframe you choose, anchor the tool to clear swings, wait for confirmation at the level, and always trade in the direction of the dominant trend.
Final Thoughts
A disciplined forex Fibonacci strategy gives traders something genuinely valuable: a precise, repeatable way to time entries on pullbacks within a trend, turning the vague instruction to “buy the dip” into a concrete plan anchored to specific, widely watched levels. By drawing the retracement across a clear swing and waiting for price to react in the 50 to 61.8 percent zone, you position yourself to join the dominant trend at favourable value rather than chasing extended moves. The forex Fibonacci levels matter both because they may reflect natural proportions and, more practically, because the collective attention of countless traders makes them at least partly self-fulfilling, concentrating the order flow that creates real support and resistance. Carolyn Boroden’s emphasis on Fibonacci clusters, the measured academic support from Lo, Mamaysky, and Wang, and Paul Tudor Jones’s reminder to always be in control all point to the same conclusion: Fibonacci is a precision tool, not a magic wand. Treat each level as a zone of probability, demand confirmation before entering, anchor every trade to a logical stop, and practise on a demo account first.