
Introduction
If you searched for a forex trading strategies pdf, you want one thing: a clear, complete playbook you can keep, study, and trust. This guide delivers exactly that. Instead of pushing a pirated download or a flimsy ebook, we teach the real strategies here, in full, so you can read, save, or print this page as your own reference. You will learn trend following, breakout trading, range and support-resistance plays, moving average crossovers, momentum signals from RSI and MACD, scalping, swing trading, and price action. We also cover advanced approaches like multi-timeframe confluence, supply and demand zones, order blocks, and the carry trade. Along the way, you will learn to read candlestick patterns, backtest your edge, manage risk, and build a personal checklist. This is education, not financial advice. Use it to think clearly and trade with discipline.
Why a Real Guide Beats a Random PDF Download
The internet overflows with files promising overnight forex riches. Most are recycled, outdated, or outright pirated copies of published books. Downloading them risks malware, copyright trouble, and worse, bad information that costs you money. A forex trading strategies pdf is only valuable if the strategies inside actually work and you understand them.
That is the philosophy here. We teach the methods directly on the page. You can read them now, return to them later, and print or save this article as your own personal PDF reference. Browsers make this simple. Use the print function and choose “Save as PDF.” You then own a clean, trustworthy copy with no shady source attached.
Knowledge beats a downloaded file every time. A strategy you understand can adapt to changing markets. A file you skimmed once cannot. Treat this guide as a workbook. Read each section slowly, test the ideas on a demo account, and keep notes. That process builds skill no PDF can hand you for free.
Trend Following: Trading With the Market’s Direction
Trend following is the foundation of most successful approaches. The idea is simple. Markets often move in sustained directions, and trading in that direction puts probability on your side. The old saying, “the trend is your friend,” survives because it holds.
To find a trend, look at higher timeframes first. On a daily or four-hour chart, a series of higher highs and higher lows signals an uptrend. Lower highs and lower lows signal a downtrend. A 50-period and 200-period moving average can confirm direction. When price holds above both and the averages slope up, the bias is bullish.
Entry comes on pullbacks. In an uptrend, wait for price to dip toward a moving average or a prior support level, then enter as it resumes upward. Place your stop below the recent swing low. Target the next resistance or trail your stop to ride the move. Patience matters here. Trend traders accept fewer signals in exchange for larger, cleaner runs.
Breakout Trading: Catching the Move Early
Breakout trading targets the moment price escapes a defined range. Markets often coil into tight consolidation before exploding in one direction. The trader who positions at the edge can capture the early surge.
Identify a clear level first. This might be a horizontal resistance line, a chart pattern boundary, or a session high. When price closes decisively beyond that level on rising volume, the breakout is confirmed. Enter in the direction of the break, set your stop just inside the broken level, and aim for a target measured by the height of the prior range.
False breakouts are the main risk. Price pokes past a level, traps eager traders, then reverses. To filter these, wait for a candle to close beyond the level rather than reacting to a wick. Some traders wait for a retest, where price returns to the broken level and holds it as new support or resistance. That retest often offers a safer, higher-probability entry.
Range and Support-Resistance Trading
Markets trend only part of the time. Often they oscillate between a floor and a ceiling. Range trading exploits this by buying near support and selling near resistance, the reverse of breakout logic.
The skill lies in identifying levels that hold. Support is a price zone where buyers repeatedly step in. Resistance is where sellers consistently push back. The more times a level is tested without breaking, the more significant it becomes. Draw these zones as areas, not thin lines, because markets respect regions rather than exact prices.
In a clean range, buy near support with a stop just below it, and target the opposite boundary. Sell near resistance with a stop just above. Confirmation strengthens entries. A bullish candlestick at support or a bearish one at resistance adds conviction. Always plan for the range to eventually break, because it will. When price closes firmly beyond a boundary, the range is over and a breakout strategy takes over.
Moving Average Crossover Systems
The moving average crossover is a classic mechanical strategy, ideal for traders who want clear, rules-based signals. It uses two moving averages of different lengths, often a faster one like the 20-period and a slower one like the 50-period.
When the faster average crosses above the slower, momentum is turning up, signaling a potential long. When the faster crosses below the slower, it signals a potential short. Because the rules are objective, the strategy is easy to backtest and removes emotion from entries.
The weakness is lag. Moving averages react to past prices, so crossovers can arrive late and produce whipsaws in choppy markets. Traders reduce this by adding a trend filter, such as only taking crossover longs when price sits above the 200-period average. Combining the crossover with a momentum check or a support level further improves the quality of each signal.
Momentum Trading With RSI and MACD
Momentum strategies measure the speed and strength of price moves. Two indicators dominate here: the Relative Strength Index and the Moving Average Convergence Divergence.
The RSI ranges from zero to one hundred. Readings above 70 suggest an overbought condition, while readings below 30 suggest oversold. Many traders use these zones to anticipate reversals, but the more powerful signal is divergence. When price makes a new high but RSI makes a lower high, momentum is fading and a reversal may follow.
The MACD tracks the relationship between two moving averages and a signal line. A crossover of the MACD line above its signal line hints at building bullish momentum. Histogram bars that shrink toward zero warn that a move is losing steam. Used together, RSI and MACD confirm whether a trend has the energy to continue or is quietly running out of fuel. Momentum tools work best alongside trend and price-action context, never in isolation.
Scalping and Swing Trading: Two Timeframes, Two Mindsets
Scalping and swing trading sit at opposite ends of the timeframe spectrum, and each demands a different temperament.
Scalping aims for many small gains over minutes. Scalpers trade the one-minute and five-minute charts during high-liquidity sessions, such as the London and New York overlap. They chase tight spreads, fast execution, and small but frequent profits. The approach is intense. It rewards focus, quick decisions, and strict discipline, since a single oversized loss can erase many small wins.
Swing trading works on the four-hour and daily charts, holding positions for days or weeks. Swing traders capture larger moves and need far less screen time. They lean on trend structure, key levels, and candlestick signals to time entries, then let trades breathe. The wider stops require patience and a calm acceptance of open fluctuation. Choose the style that fits your schedule and personality. Forcing a scalper’s pace onto a swing trader’s mind, or the reverse, usually ends in frustration and mistakes.
Price Action Trading: Reading the Raw Chart
Price action trading strips away indicators and reads the chart itself. The premise is that every fundamental and emotional force already shows up in price. Learn to read the structure, and you need little else.
Price action traders study swing highs and lows to map structure, then watch how price behaves at key levels. Does it stall, reject sharply, or push through? They read candlestick patterns for clues about who controls the moment, buyers or sellers. A long rejection wick at support tells a clear story without a single indicator.
This style is flexible and works across all markets and timeframes. It does, however, demand screen time and experience. Patterns that look obvious in hindsight feel ambiguous in real time. The reward is a deeper, more intuitive feel for the market that mechanical systems rarely provide.
Forex Candlestick Patterns PDF: The Signals That Matter
A strong forex candlestick patterns pdf section is essential to any complete strategy guide, because candlesticks are the language of price action. Each candle shows the open, high, low, and close, and certain shapes reveal shifts in control between buyers and sellers.
The pin bar has a small body and one long wick. A bullish pin bar at support, with a long lower wick, shows sellers were rejected and buyers seized control. The engulfing pattern uses two candles, where the second fully engulfs the first body. A bullish engulfing after a downtrend signals a possible reversal upward. The doji has almost no body, marking indecision and a potential turning point, especially after a strong move.
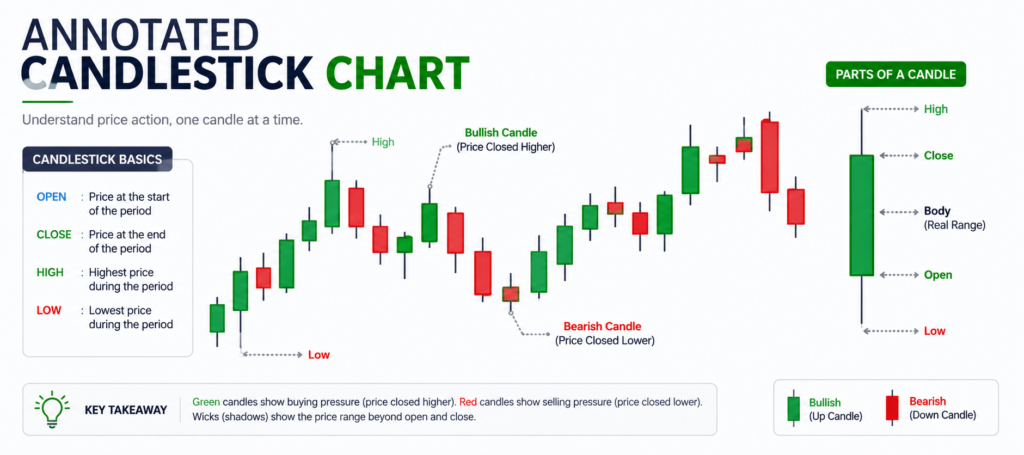
Fig 1.1 Forex candlestick patterns pdf chart
The hammer resembles a bullish pin bar at the bottom of a decline, hinting at exhaustion among sellers. The morning star is a three-candle bottoming pattern: a large bearish candle, a small indecisive candle, then a strong bullish candle. Its mirror, the evening star, warns of a top. Candlestick signals work best at meaningful levels, confirmed by trend and momentum. A pattern alone is a clue, not a command.
Advanced Forex Trading Strategies
Once the basics feel natural, advanced forex trading strategies add depth and precision. These methods combine context, structure, and timing rather than chasing a single signal.
Multi-timeframe confluence is the cornerstone. You use a higher timeframe, such as the daily, to define the dominant trend, then drop to a lower timeframe, such as the one-hour, to time a precise entry in that direction. When the bias, a key level, and a candlestick signal all align across timeframes, the trade carries far stronger odds.
Supply and demand trading refines support and resistance. Demand zones are areas where aggressive buying once caused a sharp rally, and supply zones are where heavy selling sparked a drop. Price often returns to these origin zones and reacts again, offering high-quality entries with tight stops. Order blocks extend this institutional logic. An order block is the final candle before a powerful move, marking where large players likely positioned. Traders watch for price to revisit that block and resume the original direction.
The carry trade operates on a different axis entirely. Instead of chart timing, it earns the interest-rate difference between two currencies. You buy a higher-yielding currency against a lower-yielding one and collect the daily rollover, hoping the exchange rate stays stable or moves favorably. It can pay steadily for long stretches, but it carries real risk during volatile market shocks, when prices can swing violently against the position. These advanced methods reward study, screen time, and disciplined testing.
Strategy Comparison Table
| Strategy | Best Timeframe | Best Market Condition | Difficulty |
|---|---|---|---|
| Trend Following | H4 to Daily | Strong directional trend | Beginner to Intermediate |
| Breakout Trading | H1 to H4 | Volatility after consolidation | Intermediate |
| Range / Support-Resistance | M30 to H4 | Sideways, non-trending | Beginner |
| Moving Average Crossover | H1 to Daily | Trending markets | Beginner |
| Momentum (RSI / MACD) | H1 to H4 | Trending or reversing | Intermediate |
| Scalping | M1 to M5 | High liquidity sessions | Advanced |
| Swing Trading | H4 to Daily | Trending or ranging | Intermediate |
| Price Action | All timeframes | Any, with clear structure | Intermediate to Advanced |
| Multi-Timeframe Confluence | Mixed | Trending with clean levels | Advanced |
| Supply & Demand / Order Blocks | H1 to Daily | Reaction at key zones | Advanced |
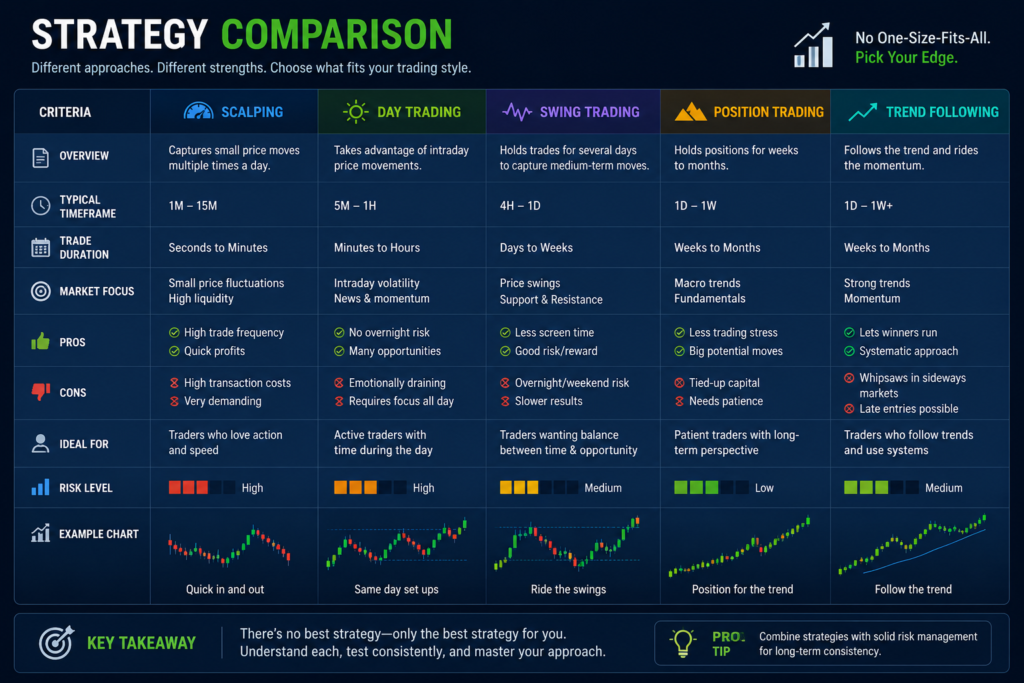
Fig 1.2 Forex trading strategies pdf
What Makes a Strategy Reliable
A reliable strategy is not the one with the flashiest name. It is the one with a defined edge, clear rules, and a positive expectancy over many trades. Reliability comes from consistency, not from a single lucky win.
Three pillars support it. First, the rules must be objective. You should know exactly when to enter, where to place your stop, and when to exit, before the trade begins. Second, the strategy must fit your timeframe and temperament, because a method you cannot follow under pressure is worthless. Third, it must survive testing across different market conditions. A strategy that works only in a strong trend will struggle when the market turns sideways.
No strategy wins every trade. A solid one might win only half its trades yet stay profitable through favorable risk-to-reward ratios. Judge a method by its long-run results across dozens of trades, never by the outcome of one.
Backtesting: Proving Your Edge Before You Risk Money
Backtesting is how you check whether a strategy holds up before risking real capital. You apply your exact rules to historical price data and record what would have happened.
Start by writing your rules down with no ambiguity. Then scroll back on the chart and step forward candle by candle, logging each trade your rules would have triggered. Track entries, exits, wins, losses, and the risk-to-reward of each. After fifty to one hundred trades, patterns emerge. You see your win rate, your average winner versus loser, and the worst losing streak you must be able to stomach.
Forward testing comes next. Run the strategy live on a demo account, where real-time decision-making adds pressure that hindsight hides. Only after a strategy proves itself in both backtesting and demo trading does it earn real money. This disciplined process separates serious traders from gamblers.
Risk Management: The Real Key to Survival
Strategy gets the attention, but risk management keeps you in the game. The market eventually punishes anyone who ignores it. Protecting capital is the first job of every trader.
The core rule is to risk only a small fraction of your account on any single trade, often one to two percent. Position sizing flows from this. Once you know your stop distance and your risk limit, you calculate the exact lot size so a loss stays within that fraction. This single habit prevents one bad trade from wrecking an account.
A favorable risk-to-reward ratio compounds the benefit. Aiming for at least two units of reward for every unit risked means you can be wrong more often than right and still profit. Always set a stop loss before entering. Never widen it in hope. Risk management is unglamorous, but it is the discipline that turns a decent strategy into a durable one.
How to Turn This Guide Into Your Personal PDF and Checklist
You came for a downloadable resource, so here is the honest, safe way to get one. Use your browser’s print function and select “Save as PDF.” You instantly own a clean copy of this entire guide, with no piracy and no malware risk.
Better still, build a one-page checklist from it. Distill each strategy into its trigger, its stop placement, and its target. Add your risk rules at the top: maximum risk per trade, required risk-to-reward, and the sessions you trade. Before every position, run through the checklist. This simple habit forces discipline and catches emotional decisions before they cost you. A personal, self-made reference beats any random file you could download, because you wrote it and you understand every line.
What Top Traders and Research Say
Serious traders learn from credible sources, not anonymous files. One enduring classic is Steve Nison’s Japanese Candlestick Charting Techniques, the book that introduced candlestick analysis to Western traders and remains a definitive reference for reading price patterns. For currency-specific tactics, Kathy Lien’s Day Trading and Swing Trading the Currency Market is widely respected for blending technical and fundamental approaches.
On the research side, the academic paper “Foundations of Technical Analysis” by Andrew Lo, Harry Mamaysky, and Jiang Wang (2000) used rigorous statistical methods and found that certain technical patterns do carry measurable information, lending real evidence to chart-based analysis.
Frequently Asked Questions
Is there a single best forex trading strategies pdf I can download?
No single file is best, and most downloads simply repackage public knowledge or pirate published books. The smarter move is to learn the strategies directly, as taught in this guide, then save the page as your own forex trading strategies pdf. That gives you a trustworthy, malware-free reference you actually understand and can apply.
What forex strategy is best for beginners?
Beginners often start well with trend following or support-resistance trading. Both use clear, visual rules and forgiving timeframes like the four-hour and daily charts. They teach you to read market structure without the pressure of fast scalping. Pair either with strict risk management, and you build a solid foundation before exploring more advanced setups.
Are candlestick patterns reliable in forex?
Candlestick patterns are useful clues, not guarantees. A forex candlestick patterns pdf approach works best when patterns appear at meaningful support, resistance, supply, or demand zones and align with the broader trend. A pin bar or engulfing candle in isolation is weak. The same pattern at a key level, confirmed by momentum, becomes a far stronger signal.
How are advanced forex trading strategies different from basic ones?
Advanced forex trading strategies layer multiple factors together rather than relying on one signal. Multi-timeframe confluence, supply and demand zones, order blocks, and the carry trade all demand more context, screen time, and discipline. They reward experienced traders with sharper entries and tighter stops, but they require thorough backtesting before you commit real capital.
Do I need indicators, or is price action enough?
Both approaches can work. Price action alone, reading structure and candlesticks, is powerful and flexible once you gain experience. Indicators like RSI and MACD add objective confirmation and suit traders who prefer clear signals. Many traders blend the two, using price action for context and indicators to confirm momentum before entering.
How important is backtesting before trading a strategy?
Backtesting is essential. It shows whether your rules carry a genuine edge before you risk money, and it reveals your likely win rate and worst drawdown. Combine historical backtesting with forward testing on a demo account. Only a strategy proven in both deserves real capital, since this process separates disciplined traders from hopeful gamblers.
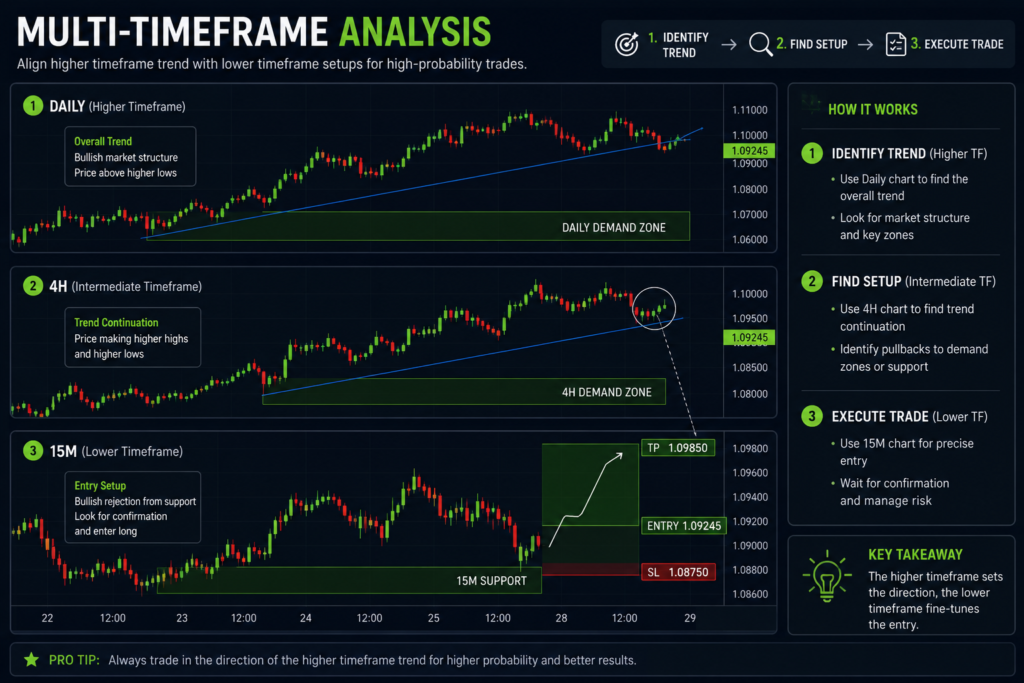
Fig 1.3 Advanced forex trading strategies
Final Thoughts
You searched for a forex trading strategies pdf because you wanted a complete, trustworthy playbook, and that is exactly what this guide delivers. We covered trend following, breakouts, ranges, moving average crossovers, momentum, scalping, swing trading, and price action, then moved into advanced forex trading strategies and a full forex candlestick patterns pdf breakdown. Most importantly, we tied every method to backtesting, reliability, and risk management, the disciplines that actually keep traders in the game. Skip the pirated downloads. Save or print this page, build your personal checklist, and test every idea on a demo account before risking real money. Remember, this is education, not financial advice, and trading carries real risk. For more deep-dive guides, strategy breakdowns, and market insights, keep learning with us at forexmarkettrendss.com and turn knowledge into disciplined, confident trading.