
Introduction
Price tells you where the market went, but forex volume indicators tell you how much conviction carried it there. That second layer of information is what separates guessing from reading the tape. In this guide, you will learn what volume really means in the decentralized forex market, why tick volume stands in for true volume, and how to apply the most trusted volume tools to confirm breakouts, expose weak trends, and time entries with more confidence. We will compare the leading indicators side by side, walk through practical setups, and look at what respected traders and academic research say about volume analysis. Whether you trade majors on the four-hour chart or scalp the London open, understanding volume will sharpen every decision you make. By the end, you will know which tools fit your style and how to avoid the common traps that catch newer traders.
Why Volume Matters in a Decentralized Market
Volume measures participation. In stock and futures markets, it counts the actual number of shares or contracts traded through a central exchange. Forex is different. It is an over-the-counter market spread across thousands of banks, brokers, and liquidity pools, so no single authority publishes a complete transaction count. That structural reality shapes everything about how traders approach forex volume indicators, and it is the first thing you must understand before trusting any volume reading.
Because there is no central tape, most platforms display forex tick volume instead of true traded volume. A tick is a single change in price, so tick volume counts how many times the price moved during a given period, not how many lots changed hands. At first this sounds like a poor substitute. In practice, decades of trader experience and several studies have shown that tick volume correlates strongly with actual volume during active sessions. When the market is busy, prices update more often, so a high tick count reliably reflects heavy participation.
This matters because volume gives context that price alone cannot. A breakout on rising volume signals genuine commitment from buyers or sellers. The same breakout on thin volume often fades, trapping traders who chased it. By reading participation alongside direction, you gain a feel for whether the crowd is truly behind a move or whether it is drifting on autopilot. That single insight, applied consistently, can filter out a surprising number of low-quality trades.
Tick Volume vs Real Volume: What You Are Actually Seeing
The distinction between tick volume and real volume deserves its own discussion because it is the source of most confusion. Real volume, sometimes called real volume forex, is only available through certain brokers that aggregate trades from their own liquidity providers, or through futures-based currency contracts on exchanges like the CME. If you trade currency futures, you get genuine exchange volume. If you trade spot forex through a typical retail broker, you almost certainly see tick volume.
Neither figure is perfect, and the difference rarely breaks a well-built strategy. Tick volume captures relative activity within your broker’s feed, which is usually enough to compare one candle against its neighbors. The key is consistency: as long as you use the same data source, the comparison stays valid. Problems arise when traders treat tick volume as an absolute, cross-market truth. It is not. It is a proxy, and a good one, but a proxy nonetheless.
A practical habit is to focus on volume changes rather than raw numbers. You are not asking “how many lots traded,” you are asking “is participation rising or falling compared to recent bars.” Framed that way, tick volume becomes a dependable confirmation tool. The table below summarizes the trade-offs so you can choose the right data for your situation.
| Aspect | Tick Volume | Real Volume |
|---|---|---|
| Availability | Standard on most spot forex platforms | Limited brokers and currency futures |
| What it measures | Number of price changes per period | Actual lots or contracts traded |
| Accuracy | Strong proxy during active sessions | Precise but venue-specific |
| Best use | Comparing relative activity on one feed | Institutional and futures analysis |
| Limitation | Not an absolute count | Often paid or broker-restricted |
On Balance Volume: The Classic Confirmation Tool
On balance volume forex, usually written as OBV, is one of the oldest and most respected volume tools, developed by Joseph Granville in the 1960s. The concept is elegant. On every up bar, the period’s volume is added to a running total. On every down bar, it is subtracted. The resulting line rises when buyers dominate and falls when sellers take control. What you watch is the slope and the divergences, not the absolute value.
The real power of OBV shows up in divergence. Suppose price grinds to a new high but the OBV line fails to follow, drifting sideways or sloping down. That gap warns that the rally lacks broad participation, hinting the move may be running out of fuel. The reverse applies at lows. When price makes a fresh low while OBV holds firm or turns up, smart money may be quietly accumulating before a reversal. These signals are not guarantees, but they routinely arrive ahead of obvious price action.
OBV works best as a confirmation layer rather than a standalone signal generator. Pair it with a clear trend or a key support and resistance level, then let OBV tell you whether participation agrees. Because it is a cumulative line, OBV is also forgiving of the tick versus real volume debate. It cares about direction and relative magnitude, both of which tick volume captures well on a single feed.
Volume Weighted Average Price and the Money Flow Family
Volume weighted average price forex, known as VWAP, has migrated from the institutional desk to the retail screen, and for good reason. VWAP plots the average price weighted by volume across a session, giving you a fair-value benchmark that big players genuinely watch. When price trades above VWAP, buyers are paying a premium and momentum leans bullish. When it slips below, sellers have the edge. Many intraday traders use VWAP as a dynamic line to fade extremes or to anchor pullback entries during the London and New York sessions.
The money flow group adds another dimension by blending price and volume into oscillators. The money flow index forex, or MFI, behaves like a volume-weighted version of the RSI, oscillating between zero and one hundred to flag overbought and oversold conditions backed by participation. Chaikin Money Flow measures buying and selling pressure over a set lookback, while the Accumulation Distribution line tracks whether each bar closes in its upper or lower range relative to volume. Together these tools help you judge not just where price sits, but who is in control.
These indicators reward traders who respect their design. VWAP is built for intraday work and loses meaning when stretched across many days. MFI shines in ranging conditions but can stay pinned in strong trends, so context is everything. Used thoughtfully, the money flow family turns raw participation into readable pressure, which is exactly what disciplined trading demands.
Volume Profile and Order Flow: Reading Where Trades Cluster
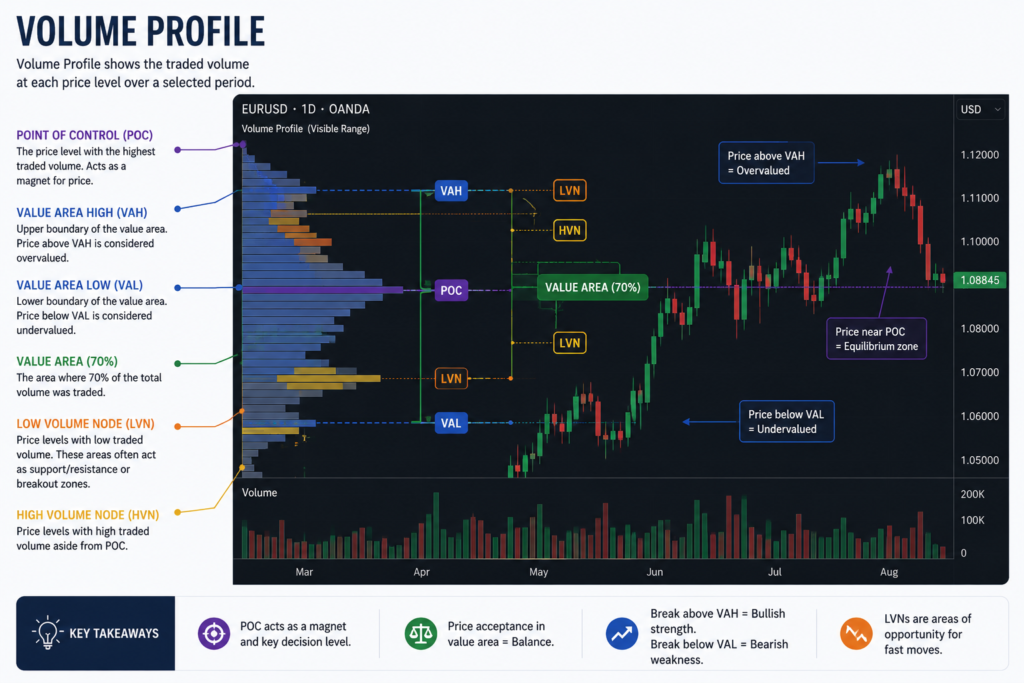
While most indicators plot volume against time, volume profile forex flips the axis and plots volume against price. The result is a horizontal histogram showing how much activity occurred at each price level over your chosen range. The fattest bar marks the Point of Control, the price where the most trading happened, and the cluster of high-activity prices forms the Value Area. These zones act as magnets and barriers because they represent prices where the market agreed value existed.
This view is powerful for planning. High-volume nodes tend to attract price and offer reliable support or resistance, while low-volume gaps often see price move quickly, since few participants are anchored there. Swing traders use the profile to set targets and stops around meaningful levels rather than arbitrary round numbers. Day traders watch how price reacts at the developing Point of Control to gauge intraday balance and imbalance.
Order flow takes the idea further by examining the live tug-of-war between aggressive buyers and sellers. Tools like cumulative volume delta track the net difference between market buy and sell orders, exposing absorption and exhaustion in real time. Order flow is more advanced and demands quality data, often from futures feeds, but it offers the closest thing retail traders have to watching institutional intent unfold. For those willing to invest the learning time, it is among the most revealing approaches available.
Choosing the Best Forex Volume Indicator for Your Style
There is no single best forex volume indicator that wins for everyone, and any guide claiming otherwise is overselling. The right tool depends on your timeframe, your strategy, and how much complexity you can manage without freezing on every decision. A scalper has very different needs from a position trader, and the smart move is to match the indicator to the job rather than collecting all of them at once.
Intraday and scalping traders gravitate toward VWAP and relative volume because both react quickly and frame the current session cleanly. Swing traders often prefer OBV and volume profile, which reveal accumulation and key levels that play out over days. Traders who want a single pressure gauge frequently settle on the money flow index or Chaikin Money Flow. The table below maps common goals to sensible starting points.
| Trading Style | Suggested Indicator | Why It Fits |
|---|---|---|
| Scalping | VWAP, relative volume | Fast, session-anchored, intraday focus |
| Day trading | Volume profile, OBV | Highlights levels and confirms momentum |
| Swing trading | OBV, accumulation distribution | Reveals multi-day accumulation and divergence |
| Trend following | Money flow index, Chaikin Money Flow | Gauges sustained buying or selling pressure |
| Advanced execution | Cumulative volume delta, order flow | Exposes real-time aggression and absorption |
Whatever you choose, resist the urge to stack five volume tools on one chart. They largely measure the same underlying force and will only crowd your judgment. Pick one or two, learn their behavior in live markets, and let price action lead while volume confirms. Mastery of a single tool beats dabbling in many.
Practical Volume Strategies That Actually Work
The most durable application of volume indicator forex analysis is breakout confirmation. When price breaks a well-defined range or trendline, check whether volume expands on the breakout candle. A surge in participation supports the move and improves the odds it continues. A breakout on flat or declining volume deserves suspicion and often turns into a false break that snaps back into the range, taking impulsive traders with it. This one filter alone can transform a mediocre breakout system.
Divergence is the second workhorse. As discussed with OBV, a disagreement between price and volume momentum frequently precedes a reversal or pause. Apply the same logic with the money flow index near support and resistance. When price pushes to an extreme but the volume oscillator refuses to confirm, tighten stops or wait for a cleaner setup. Divergence is not a precise timing tool, so treat it as a yellow light rather than an instant trade trigger.
A third reliable tactic is the volume-confirmed pullback. In an established trend, healthy pullbacks usually come on lighter volume, signaling profit-taking rather than a genuine shift in control. When price resumes the trend and volume returns, you have a higher-probability continuation entry. Combining this with VWAP or a volume profile node gives you both a participation signal and a structural level, which is far stronger than either alone. The throughline across every strategy is the same: volume confirms, price decides.
What Top Traders and Research Say
Serious study of volume is well supported by the literature. John Murphy’s Technical Analysis of the Financial Markets remains a foundational reference and devotes clear attention to volume as a confirming indicator, framing it as the fuel that validates price trends. For traders building a library, it is one of the most cited and trusted texts in the field, and its treatment of volume holds up well even in the forex context.
On the academic side, the influential paper “Foundations of Technical Analysis” by Andrew Lo, Harry Mamaysky, and Jiang Wang, published in the Journal of Finance in 2000, applied rigorous statistical methods to technical patterns and found that several carry measurable informational value rather than being pure noise. While the study focused on equities, its core message gives credibility to systematic technical analysis, including the structured use of participation data that volume tools provide.
Finally, the discretionary edge of reading the tape echoes a famous line from trader Paul Tudor Jones: “Markets move in the direction of liquidity.” Volume is one of the clearest windows into where that liquidity is flowing. Combining a respected text, peer-reviewed research, and hard-won trader wisdom gives you a grounded, honest basis for taking volume seriously without overstating what any single indicator can promise.
Frequently Asked Questions (FAQs)
Are forex volume indicators accurate if forex has no central exchange?
They are accurate enough to be useful. Most platforms show forex tick volume, which counts price changes rather than lots traded. Studies and long experience show tick volume tracks real participation closely during active sessions. As long as you use one consistent data feed, forex volume indicators reliably reveal whether participation is rising or fading behind a move.
What is the best forex volume indicator for beginners?
For newer traders, on balance volume forex and VWAP are excellent starting points. OBV makes divergence easy to spot, while VWAP gives a clear intraday fair-value line. Both are simple to read and built into MT4, MT5, and TradingView. Master one before adding more, since stacking too many volume tools clutters your judgment rather than improving it.
How do I confirm a breakout with a volume indicator forex setup?
Watch the breakout candle for a clear expansion in volume. Strong participation supports the move and raises the odds it continues. A breakout on thin or falling volume often becomes a false break that reverses into the range. Pairing this volume confirmation with a defined support and resistance level gives you a far more dependable entry signal.
What is the difference between tick volume and real volume forex?
Real volume forex counts the actual lots or contracts traded and is mainly available through certain brokers or currency futures. Tick volume counts the number of price changes per period and is standard on most spot platforms. Tick volume is a proxy, but a strong one, so it remains the practical choice for everyday forex volume analysis.
Can I use volume profile forex for swing trading?
Yes, volume profile forex suits swing trading well. It plots volume against price, revealing the Point of Control and Value Area where the market agreed value existed. These high-activity zones often act as durable support and resistance, helping you place stops and targets around meaningful levels instead of arbitrary numbers, which strengthens your overall trade plan.
Final Thoughts
Volume is the missing context that turns a price chart into a story about conviction. Throughout this guide you have seen how forex volume indicators confirm trends, expose weak breakouts, and warn of reversals through divergence, all while accounting for the tick volume reality of a decentralized market. The most effective approach is rarely the most complicated one. Choose one or two tools that match your timeframe, learn how they behave in live conditions, and let volume confirm what price action already suggests. Whether you favor the simplicity of OBV, the intraday clarity of VWAP, or the structural depth of volume profile, the principle stays constant: price decides, and volume confirms. Apply these ideas with patience and a written plan, and you will trade with sharper conviction and fewer impulsive mistakes.