
Introduction
If you have ever watched a strong currency move stall at an invisible price and reverse, you have likely seen Fibonacci math at work. Understanding the trend based fibonacci numbers meaning forex traders depend on can turn that mystery into a repeatable edge. The trend-based Fibonacci tool projects price targets in the direction of an existing move, helping you map where a trend may extend rather than where it merely pulls back. In this guide you will learn what the tool is, how it differs from a standard retracement, and what each key ratio signals. We will connect these projections to wave structure, walk through a practical eur usd elliott wave analysis example, and show how the levels align with broader forex market trends. You will also learn drawing technique, confluence, common mistakes, and disciplined risk management. By the end, you will read Fibonacci projections with clarity and confidence.
What the Trend-Based Fibonacci Tool Actually Is
The trend-based Fibonacci tool is a charting instrument that projects future price targets in the direction of an established trend. You will find it in TradingView, MetaTrader, and most professional platforms, often labeled “Trend-Based Fib Extension.” Unlike a basic retracement, this tool uses three anchor points rather than two. Those three points define a complete price swing: a starting low, a swing high, and the end of the corrective pullback. The platform then projects extension ratios beyond the original move, suggesting where the trend may travel next.
This three-point structure is the heart of the trend based fibonacci numbers meaning forex analysts watch closely. The first leg measures the impulse. The pullback measures the correction. The projection measures the likely continuation. Because the tool anchors to real swing structure, it adapts to each market move instead of relying on fixed horizontal lines. The numbers it draws are not magic. They are proportional relationships derived from the Fibonacci sequence, applied to the geometry of price.
In practice, the tool answers a single question: if this trend continues, how far might price reasonably travel before stalling? That makes it a forward-looking instrument, well suited to traders who want to plan profit targets in advance rather than react after the fact.
How It Differs From Standard Fibonacci Retracement
Many traders confuse retracement with extension, yet the two tools serve opposite purposes. A standard Fibonacci retracement uses two points, a swing high and a swing low, and measures how far price pulls back within an existing move. Its levels, such as 0.382, 0.5, and 0.618, sit between the two anchors. Traders use retracement to find entry zones during a pullback.
The trend-based extension flips the focus. It uses three points and projects levels beyond the original swing, into untraded price. Where retracement asks “how deep is the pullback,” extension asks “how far will the next leg run.” This distinction matters because the two tools are often used together. You retrace to find your entry, then extend to set your target.
Consider a simple sequence. Price rallies, pulls back, then resumes higher. The retracement helps you buy the dip near 0.618. The trend-based extension then projects the 1.272 or 1.618 level as a logical destination. Reading both tools in tandem gives you a complete trade map: where to enter, where to exit, and where the move loses momentum. Understanding this pairing is essential to applying Fibonacci within real forex market trends.
The Meaning of Each Key Fibonacci Level
Every ratio the tool draws carries a specific behavioral meaning. The retracement ratios describe corrective depth, while the extension ratios describe continuation distance. The table below summarizes the key levels and what each typically signals on a trending currency pair.
| Fibonacci Level | Type | Typical Meaning in Forex |
|---|---|---|
| 0.382 | Retracement | Shallow pullback; strong underlying trend, momentum intact |
| 0.5 | Retracement | Balanced pullback; common psychological reaction point |
| 0.618 | Retracement | The “golden” pullback; high-probability trend continuation zone |
| 1.0 | Extension | Equal-leg move; the new leg matches the prior impulse in size |
| 1.272 | Extension | First conservative target; common reversal or partial-profit zone |
| 1.618 | Extension | The golden extension; a primary target where trends often stall |
| 2.618 | Extension | Extended target; reached only in powerful, momentum-driven trends |
The 0.618 retracement and 1.618 extension carry the most weight because both derive from the golden ratio, the proportion most frequently observed in Fibonacci-based price behavior. A shallow 0.382 pullback signals a forceful trend with little hesitation, while a deeper 0.618 retracement still respects the trend but offers a better risk-reward entry. On the extension side, 1.272 often serves as a first profit target, 1.618 as the primary objective, and 2.618 as a stretch target reserved for explosive moves. Reading these levels as probabilities rather than guarantees keeps your expectations grounded.
How to Draw It on a Trending Move
Drawing the tool correctly is where most errors begin, so precision matters. Start by identifying a clean trending move on your chart. In an uptrend, your first click anchors to the swing low that begins the impulse. Your second click anchors to the swing high that ends it. Your third click anchors to the low of the corrective pullback that follows. The platform then projects the extension levels above the swing high.
The same logic mirrors for a downtrend. Click the swing high, then the swing low, then the high of the corrective bounce. The tool projects targets below. Accuracy depends entirely on choosing genuine swing points rather than random candles. Use higher timeframes to confirm that your chosen swings represent meaningful structure.
A practical tip: let the corrective leg complete before drawing. If you anchor the third point too early, the projection shifts as price keeps pulling back. Wait for clear evidence that the correction has ended, such as a reversal candle or a bounce from a retracement level. Clean inputs produce reliable projections. Sloppy inputs produce noise. This discipline is the difference between a tool that guides decisions and one that merely decorates a chart.
Tying It to Wave Structure and EUR USD Elliott Wave Analysis
Fibonacci projections gain real power when you read them alongside wave structure. Elliott Wave theory describes trends as five-wave impulses followed by three-wave corrections, and each wave relates to the others through Fibonacci proportions. This is why the trend-based extension feels so natural inside a wave count. The three anchor points often map directly onto waves one, two, and the start of wave three.
A practical eur usd elliott wave analysis illustrates the synergy. Suppose EUR/USD completes a clear wave one rally, then corrects in wave two to the 0.618 retracement. You anchor the trend-based tool to the wave-one low, the wave-one high, and the wave-two low. The 1.618 extension now projects a logical target for wave three, which is frequently the longest and strongest wave. As price advances, the 1.0 and 1.272 levels act as interim checkpoints, while 1.618 marks where momentum may cool.
This approach transforms abstract wave counts into measurable targets. Instead of guessing where wave three ends, you let Fibonacci math suggest a probable zone. When a projected extension aligns with the expected wave structure, your conviction rises. When they disagree, you have a warning to reassess your count. Combining wave logic with projection levels keeps your eur usd elliott wave analysis anchored in measurable price behavior rather than wishful interpretation.
Using It to Find Targets and Confluence
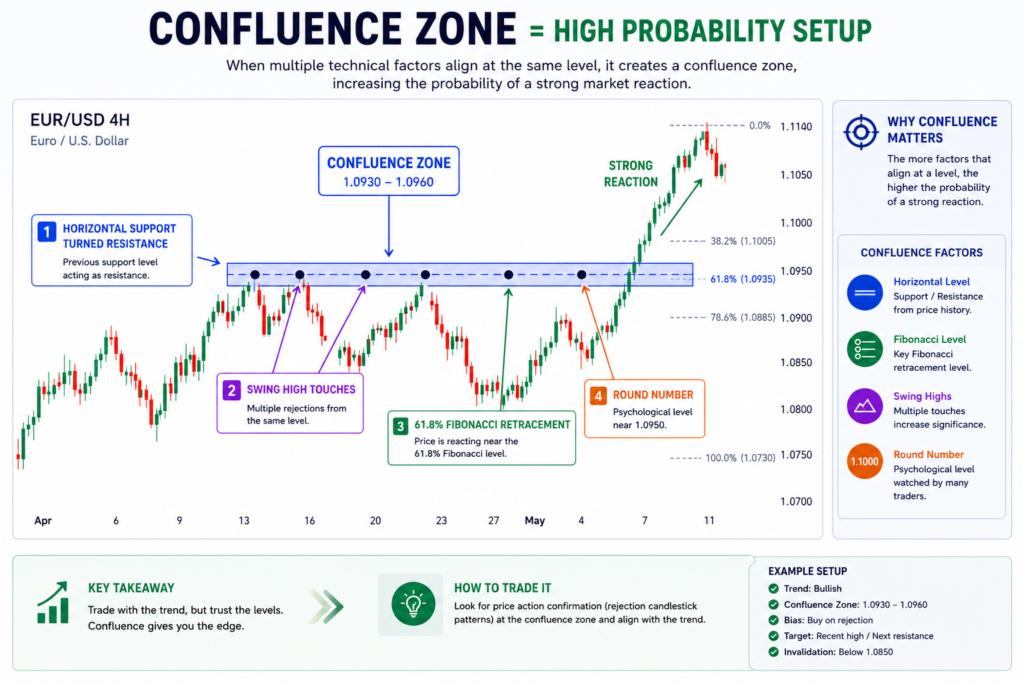
The strongest signals appear where multiple tools agree. Confluence means several independent methods point to the same price zone, raising the probability that the level matters. A single Fibonacci extension is useful. Three different signals stacking on one level is compelling.
Imagine your 1.618 trend-based extension lands at 1.1200 on EUR/USD. Now suppose a prior swing high, a round psychological number, and a longer-timeframe retracement all cluster within a few pips of that price. That convergence creates a high-conviction target zone. Price reaching it after a strong run becomes a logical place to take profit or watch for reversal signals.
You can build confluence in several ways. Layer extensions from different timeframes. Combine the trend-based tool with horizontal support and resistance. Add moving averages or trendlines. When these elements overlap, treat the zone as significant. When the extension stands alone with no supporting evidence, treat it as a softer reference. This filtering process separates probable turning points from arbitrary lines and helps you trade with the broader forex market trends rather than against them.
How It Relates to Broader Forex Market Trends
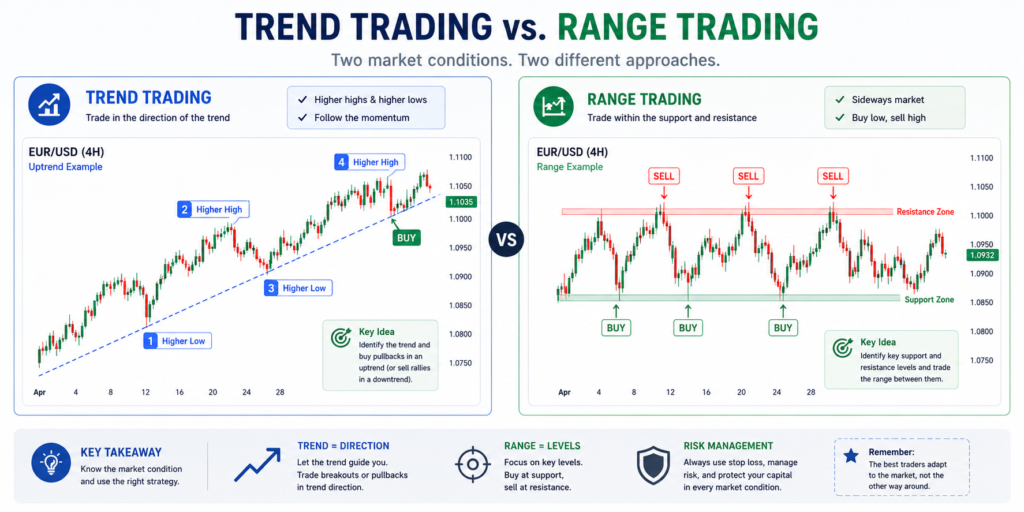
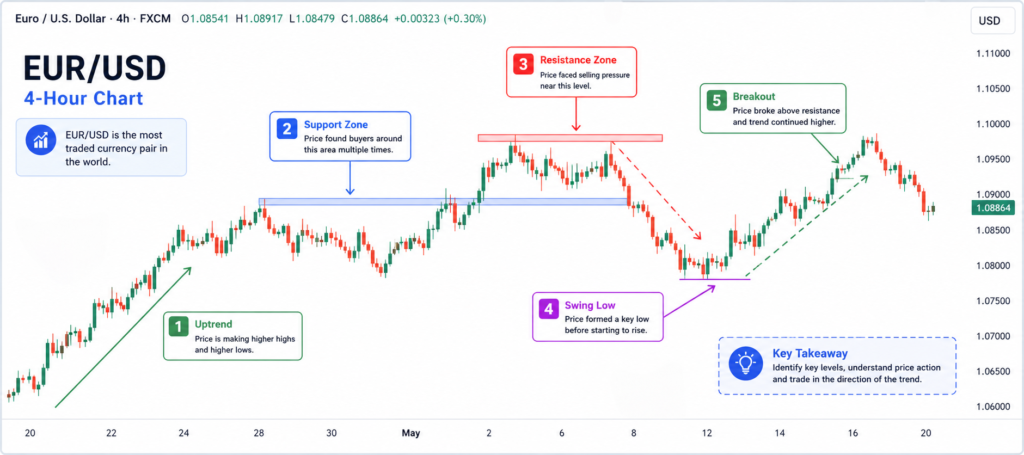
No single tool operates in a vacuum, and Fibonacci projections are only as reliable as the trend that produces them. The trend-based extension assumes a trend exists and continues. In a strong, directional market, its projections tend to hold well. In a choppy, range-bound market, the same levels lose meaning because there is no genuine trend to extend.
This is why top traders read context first. Before drawing extensions, they confirm that forex market trends support a directional bias. They check higher timeframes, assess momentum, and consider the fundamental backdrop driving the currency pair. A central bank shift, an interest-rate decision, or a major economic release can reinforce or invalidate a technical projection in seconds.
When the broader trend aligns with your extension targets, the analysis carries weight. When price action contradicts the trend, even a perfect 1.618 projection becomes unreliable. The lesson is simple: use Fibonacci to refine a directional thesis, never to manufacture one. The numbers describe proportion, but the trend supplies the direction. Respecting that hierarchy keeps your projections honest and your trades aligned with real market behavior.
Common Mistakes to Avoid
The most frequent error is anchoring to the wrong swing points. A projection built on insignificant candles produces meaningless levels. Always anchor to clear, structurally important highs and lows. The second common mistake is treating extension levels as certainties. They are probability zones, not guaranteed turning points. Price can overshoot or fall short, so plan for both outcomes.
Another pitfall is over-cluttering the chart. Some traders draw a dozen extensions until every price looks like a Fibonacci level. This false confluence misleads more than it helps. Keep your chart clean and focus on the swings that matter. A related mistake is ignoring timeframe context. A five-minute extension means little when the daily trend points the opposite way.
Finally, many traders forget that Fibonacci is a confirmation tool, not a standalone signal. Acting on an extension level alone, without price-action confirmation or supporting evidence, invites whipsaws. Wait for the market to react at the level before committing. A reversal candle, a momentum divergence, or a break of structure adds the confirmation that turns a Fibonacci reference into a tradeable signal. Avoiding these errors protects both your accuracy and your capital.
Combining With Other Tools and Risk Management
Fibonacci extensions perform best as part of a broader toolkit. Pair them with trend confirmation methods such as moving averages or the ADX indicator to verify that a real trend exists. Add momentum tools like the RSI or MACD to spot divergence as price approaches an extension target. Combine them with candlestick patterns to time entries and exits precisely. Each addition sharpens the signal that the raw projection provides.
Risk management remains the foundation that holds everything together. Even the cleanest 1.618 projection can fail, so define your risk before you enter. Place stops based on structure, typically beyond the swing that invalidates your thesis, rather than at an arbitrary distance. Size your position so a single loss never threatens your account. Many traders take partial profit at the 1.272 extension and let the remainder run toward 1.618, balancing security with opportunity.
A disciplined process turns Fibonacci from a guessing game into a framework. Identify the trend, draw the extension to project targets, confirm with confluence, then manage the trade with predefined risk. This sequence keeps emotion out of decisions and ensures that no single setup can do serious damage. Remember that this content is educational and not financial advice; test any approach thoroughly before risking real capital.
What Top Traders and Research Say
The intellectual roots of this approach run deep. In Elliott Wave Principle: Key to Market Behavior, authors A.J. Frost and Robert Prechter detail how market waves relate to one another through Fibonacci proportions, providing the theoretical foundation that connects wave structure to projection levels. For broader context, John J. Murphy’s Technical Analysis of the Financial Markets remains a standard reference on how Fibonacci ratios are applied across charting disciplines.
The Fibonacci sequence itself originates with Leonardo of Pisa, known as Fibonacci, who introduced it to Western mathematics in his 1202 work Liber Abaci. The ratio between consecutive numbers in the sequence converges toward approximately 1.618, the golden ratio (phi), which is the mathematical basis for the 0.618 and 1.618 levels traders watch. This is a well-documented mathematical fact, not a trading claim.
On the trading mindset, Jesse Livermore reportedly observed, “The big money is not in the buying and selling, but in the waiting.” The discipline to wait for price to reach a confluence zone, rather than forcing a trade, captures the patience that Fibonacci-based analysis rewards.
Frequently Asked Questions
What is the trend based fibonacci numbers meaning forex traders use most?
The tool projects price targets in the direction of an existing trend using three anchor points. Each number represents a proportional relationship from the Fibonacci sequence. Traders most often watch the 1.618 extension as a primary target and the 0.618 retracement as a high-probability entry zone. These levels describe probable price behavior within real forex market trends, not guaranteed outcomes.
How is a trend-based extension different from a retracement?
A retracement uses two points and measures pullback depth within a move. The trend-based extension uses three points and projects targets beyond the move into untraded price. Retracement helps you find entries; extension helps you set exits. Most traders use them together, retracing to enter near 0.618 and extending to target 1.272 or 1.618.
Which Fibonacci levels matter most for EUR/USD?
For eur usd elliott wave analysis, the 0.618 retracement and the 1.618 extension carry the most significance because both derive from the golden ratio. The 1.272 level often acts as a first profit target, while 2.618 appears only in powerful, momentum-driven moves. Always confirm these levels with wave structure and broader trend context before acting.
Can I rely on Fibonacci extensions alone?
No. Fibonacci projections are confirmation tools, not standalone signals. They work best when combined with trend confirmation, momentum indicators, and price-action patterns. Acting on a level without supporting evidence invites whipsaws. Wait for the market to react at the projected zone, then confirm with structure or candlestick signals before committing capital.
How do I avoid drawing the tool incorrectly?
Anchor only to genuine swing highs and lows that represent meaningful structure. Let the corrective leg complete before placing your third point, and verify your swings on a higher timeframe. Keep the chart clean by drawing only the extensions that matter. Sloppy anchoring produces misleading levels, while disciplined inputs produce reliable, tradeable projections.
Final Thoughts
The trend-based Fibonacci tool turns the geometry of a trending move into a forward-looking map of probable targets. Once you understand the trend based fibonacci numbers meaning forex professionals rely on, you can read each ratio as a behavioral signal rather than a mysterious line. The 0.618 retracement guides entries, the 1.618 extension marks primary targets, and the surrounding levels fill in the structure between them. Paired with sound eur usd elliott wave analysis, the tool aligns measurable projections with wave logic, and when those projections sit inside strong forex market trends, your conviction rises. Remember that confluence, context, and disciplined risk management transform Fibonacci from a guessing exercise into a repeatable framework. Treat every level as a probability, confirm with price action, and protect your capital on every trade. For more practical, educational trading guides like this one, visit forexmarkettrendss.com and keep building the skills that turn analysis into confident, well-planned decisions.