
Introduction
The usd/cad short-term technical analysis approach helps traders read the Canadian dollar pair with structure, not guesswork. This guide teaches you how to analyze USD/CAD across intraday and short swing horizons, blending price action with confirming indicators. You will learn what truly drives the “Loonie,” from crude oil prices and Bank of Canada policy to US data and global risk sentiment. We break down trend identification, support and resistance, moving averages, momentum tools, Fibonacci levels, and candlestick patterns. We also show how to combine these signals with the economic calendar and build a disciplined short-term trade plan with illustrative entries, stops, and targets. Every price level in this article is a hypothetical teaching example, not a live quote or signal. By the end, you will own a repeatable framework you can apply to any session, any day, with confidence and discipline.
What Actually Drives USD/CAD
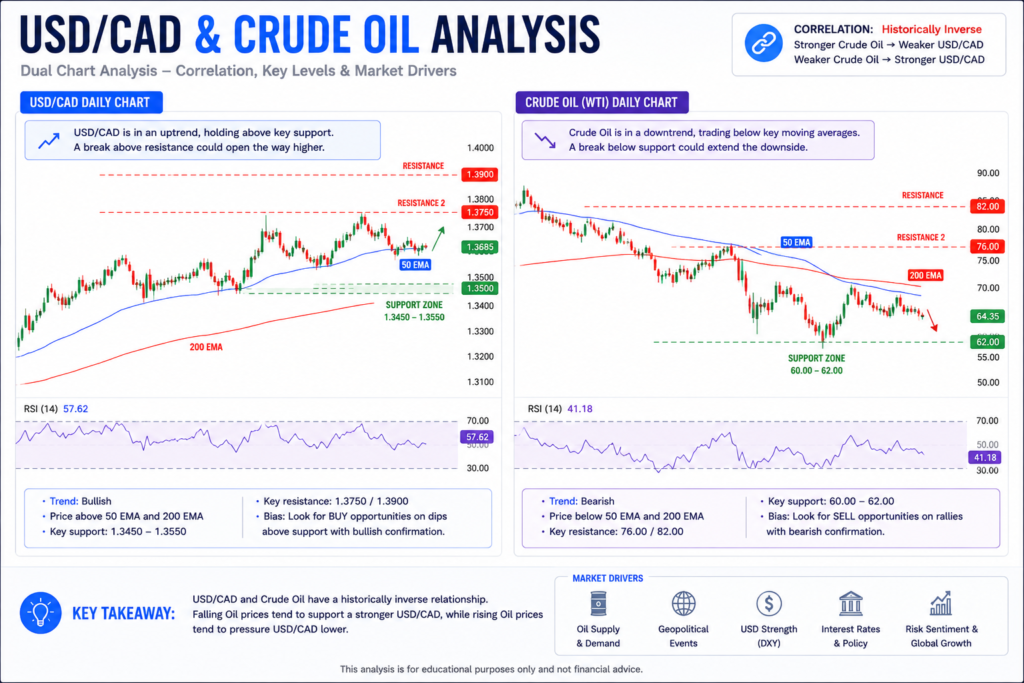
Before any chart analysis, you must understand the forces that move this pair. USD/CAD is a commodity currency relationship, and crude oil sits at the center of it. Canada is a major oil exporter, so rising crude prices tend to strengthen the Canadian dollar and push USD/CAD lower. Falling oil tends to do the opposite. This inverse relationship is not perfect, but it is strong enough that short-term traders watch oil futures alongside the currency chart.
Monetary policy is the second major driver. The interest-rate gap between the Bank of Canada and the US Federal Reserve shapes the pair’s medium trend. When the Fed sounds more hawkish than the BoC, the US dollar usually gains and USD/CAD rises. When the BoC turns more aggressive, the Loonie can claw back ground. Rate decisions, meeting minutes, and speeches from either central bank can spark sharp intraday moves.
US economic data is the third lever. Because the US dollar is half of the pair, releases like nonfarm payrolls, CPI inflation, retail sales, and ISM surveys often move USD/CAD more than Canadian data does. Canadian employment, CPI, and GDP still matter, especially when they shift BoC expectations. Finally, global risk sentiment plays a role. In risk-off moods, traders often buy the US dollar as a haven, lifting USD/CAD, while risk-on phases tend to favor the commodity-linked Loonie.
Choosing Timeframes for Short-Term Analysis
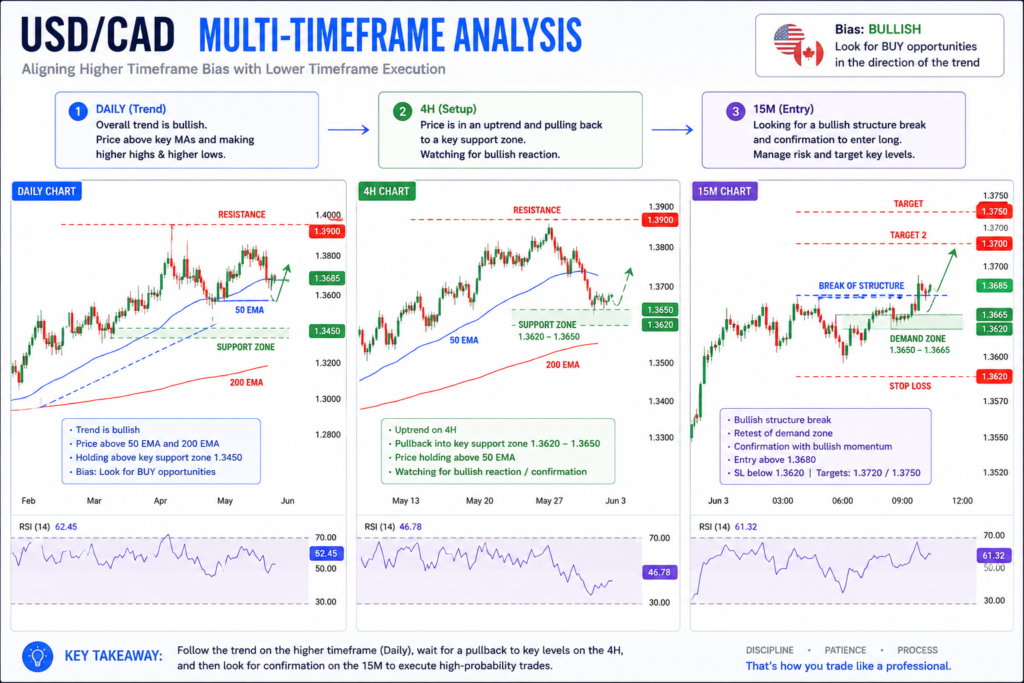
Short-term trading on USD/CAD usually means holding positions from minutes to a few days. Your timeframe choice should match that horizon. Scalpers and intraday traders typically work the 5-minute, 15-minute, and 1-hour charts, while short swing traders lean on the 4-hour and daily charts for context. The professional habit is multi-timeframe analysis: you identify the larger trend on a higher timeframe, then drop down to a lower one to time precise entries.
A practical workflow is to start on the daily chart to map the dominant direction and major levels. Move to the 4-hour chart to refine structure and spot intermediate swing points. Then use the 1-hour or 15-minute chart to locate your entry trigger. This top-down method keeps you trading in harmony with the bigger picture instead of fighting it. The same multi-timeframe discipline appears throughout our eur/usd technical analysis october 2025 breakdown, where higher-timeframe bias guided lower-timeframe entries. The framework travels well across pairs because price structure behaves consistently.
Identifying the Trend and Market Structure
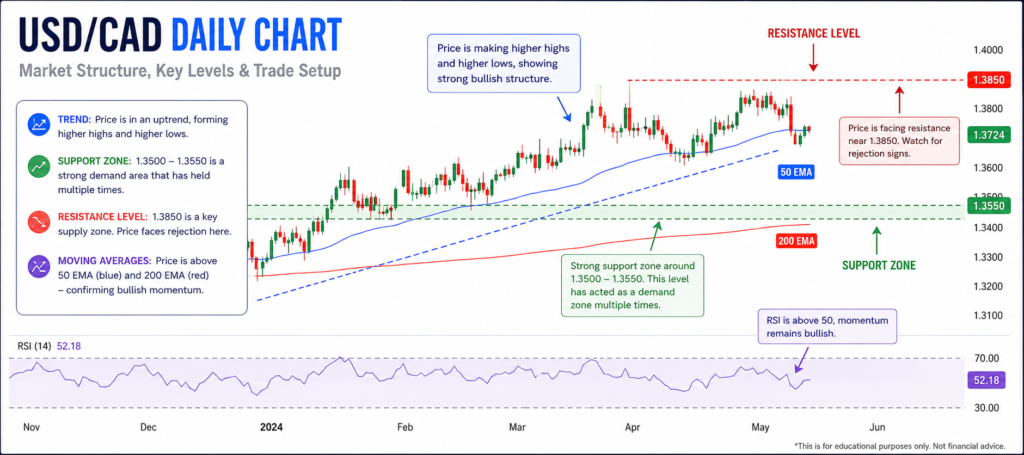
Trend identification is the foundation of any short-term analysis. The classic definition still holds: an uptrend prints higher highs and higher lows, a downtrend prints lower highs and lower lows, and a range moves sideways between roughly horizontal boundaries. On USD/CAD, you map these swing points across your chosen timeframes to define the current structure before doing anything else.
Trendlines help you visualize the path. In an uptrend, you connect rising swing lows to draw support; in a downtrend, you connect falling swing highs to draw resistance. A clean break of a well-tested trendline can signal a shift in momentum, but you should wait for confirmation rather than reacting to the first touch through the line. Market structure also reveals when a trend is weakening, for example when an uptrend fails to make a new higher high. Reading structure first prevents the common error of buying into resistance or selling into support simply because an indicator flashed a signal.
Support, Resistance, and Key Zones
Support and resistance are the price areas where buying or selling pressure has previously turned the market. Short-term traders treat these zones, not exact lines, because price often reacts within a small band rather than at a single number. You build them from prior swing highs and lows, round numbers, daily highs and lows, and prior session boundaries. Strong zones are those tested multiple times that still hold.
The table below shows illustrative, hypothetical support and resistance zones for a teaching scenario. These numbers are examples to demonstrate how you would label a chart. They are not live quotes or trade signals.
| Zone Type | Illustrative Level (example) | What It Could Signal | How to Confirm |
|---|---|---|---|
| Major resistance | 1.3850-1.3870 | Potential selling pressure, short setups | Bearish candle + RSI rejection |
| Minor resistance | 1.3780-1.3795 | Intraday cap, possible pullback | Stalling momentum on 15m |
| Pivot / balance | 1.3700 | Decision area, range midpoint | Direction of break with volume |
| Minor support | 1.3620-1.3635 | Possible bounce, long setups | Bullish reversal candle |
| Major support | 1.3540-1.3560 | Strong demand, trend-defining floor | Higher low + MACD turn |
When price approaches a zone, you watch how it behaves rather than assuming it will hold or break. A strong rejection candle near resistance suggests sellers are defending it. A clean break with follow-through suggests the zone has flipped. The same zone-mapping logic underpins our gbp/jpy forex market analysis december 2025 breakdown, where labeled supply and demand areas framed every setup. As in those examples, the goal is to react to price at decision points, not to predict exact turns.
Moving Averages for Direction and Dynamic Levels
Moving averages smooth price and reveal the underlying drift. Short-term USD/CAD traders often watch the 20-period and 50-period exponential moving averages on intraday charts, plus the 200-period for broader context. When shorter averages sit above longer ones and price holds above them, the bias leans bullish; the reverse leans bearish. A crossover, such as the 20 EMA crossing the 50 EMA, can flag a momentum shift, though crossovers lag and work best as confirmation rather than a standalone trigger.
Moving averages also act as dynamic support and resistance. In a healthy uptrend, price often pulls back to the 20 EMA and resumes higher, giving short-term traders a logical entry area with a nearby stop. The slope of the average matters too: a steep, rising line signals strong momentum, while a flattening line warns that the trend is stalling. Treat moving averages as one input in a confluence, never as a complete system on their own.
Momentum Tools: RSI, MACD, and Stochastic
Momentum oscillators tell you about the strength and speed behind price moves. The Relative Strength Index measures whether recent gains or losses are stretched. Readings above 70 suggest overbought conditions and below 30 suggest oversold, but in a strong trend RSI can stay extended for a long time, so you avoid fading a trend on RSI alone. The most powerful RSI signal for short-term traders is divergence, where price makes a new high or low but RSI does not, hinting that momentum is fading.
MACD tracks the relationship between two moving averages and its signal line. A MACD crossover with the histogram expanding can confirm building momentum in the trade direction. Like RSI, MACD shines when it agrees with structure and support or resistance. The Stochastic oscillator measures where price closes within its recent range and is popular for timing entries inside ranges and pullbacks. Used together, these tools cross-check one another: when RSI, MACD, and price structure all point the same way near a key zone, your setup has confluence. When they disagree, you stand aside.
Fibonacci, Chart Patterns, and Candlesticks
Fibonacci retracements give short-term traders a map of likely pullback areas within a trend. After a clear swing, you draw the retracement from swing low to swing high, then watch the 38.2 percent, 50 percent, and 61.8 percent levels for potential continuation entries. These levels gain weight when they overlap with a moving average or a prior support zone, creating confluence. Fibonacci extensions then help project illustrative profit targets beyond the prior swing.
Chart patterns add another layer. Continuation patterns like flags and pennants suggest the trend may resume, while reversal patterns like double tops, double bottoms, and head and shoulders warn of a possible turn. Triangles signal compression that often precedes a breakout. Candlestick patterns sharpen your timing within these structures: pin bars, engulfing candles, and inside bars at key zones reveal who is winning the short-term battle between buyers and sellers. A bullish engulfing candle at major support carries more meaning than the same candle floating in the middle of a range. Always read patterns in context, never in isolation.
Reading Momentum, Volume, and Intraday Structure
Volume confirms conviction. In forex, true centralized volume is unavailable, so traders use tick volume from their platform as a proxy. Rising tick volume on a breakout suggests genuine participation, while a breakout on thin volume is more likely to fail and reverse. Watching volume helps you separate real moves from traps, especially around session opens and news.
Intraday structure also follows the trading sessions. USD/CAD often sees its sharpest moves during the overlap of the London and New York sessions, when liquidity and US data flow peak. Many intraday traders mark the day’s opening range, the prior day’s high and low, and the session highs as reference points. Reading momentum means noticing whether each new swing extends with energy or stalls quickly. Decelerating swings, shrinking candles, and fading volume all hint that a short-term move is running out of fuel, giving you an early warning to tighten stops or take profit.
How the Oil Correlation Shapes the Loonie
Because Canada exports crude oil, USD/CAD carries a persistent inverse link to oil prices. When crude rallies, the Canadian dollar often strengthens and USD/CAD tends to drift lower; when crude slumps, USD/CAD often rises. Short-term traders treat oil as a confirming input. If your USD/CAD chart shows a bearish setup at resistance and crude is breaking higher at the same time, the two signals reinforce each other.
The correlation is dynamic, not fixed. It can tighten when oil is the dominant theme and loosen when rate differentials or risk sentiment take over. That is why you check the correlation rather than assume it. A simple habit is to keep a crude oil chart beside USD/CAD and note whether they are moving as expected. When they diverge sharply, one market is usually leading the other, and that can foreshadow a move. This kind of cross-market confluence is the same principle we apply when reading commodity and risk drivers across other pairs.
Combining Technicals with the Economic Calendar
Technical analysis tells you where price might react; the economic calendar tells you when volatility may strike. Short-term USD/CAD traders treat scheduled events as risk windows. High-impact releases include the Fed and Bank of Canada rate decisions, US nonfarm payrolls, US and Canadian CPI, Canadian employment, GDP figures, and crude oil inventory reports. Around these events, spreads widen and price can gap, so many short-term traders avoid opening fresh positions just before the print.
The smart approach is to let the calendar shape your timing and position size. You can mark event times on your chart, reduce exposure into major releases, and wait for the initial spike to settle before trading the cleaner post-news structure. Pairing a strong technical level with a calmer post-event tape often produces higher-quality setups than chasing the first volatile candle. As in our eur/usd technical analysis october 2025 and gbp/jpy forex market analysis december 2025 breakdowns, the same framework applies: respect the calendar, then let confirmed price action at key levels guide the entry.
Building a Short-Term Trade Plan
A trade plan turns analysis into disciplined action. Start with bias: define the higher-timeframe direction, then locate a setup that aligns with it on a lower timeframe. Pick a clear entry trigger, such as a rejection candle at a mapped zone or a confirmed break and retest. Place your stop where the idea is invalidated, for example beyond the zone or the swing point that anchors the trade. Set targets at the next logical level or a Fibonacci extension, and define your risk-reward before you click.
Consider this purely illustrative example. Suppose USD/CAD pulls back to a hypothetical support zone near 1.3620 in an established uptrend, prints a bullish engulfing candle, and RSI turns up from oversold. A short-term trader might enter near 1.3635, place a stop below 1.3590, and target the prior swing near 1.3780, yielding a favorable risk-reward of roughly one to three. These numbers are teaching examples only, not live signals or current quotes. The point is the structure of the plan, not the figures. Write your plan before the session, then execute it without improvising mid-trade.
Common Mistakes and Risk Management
The most frequent short-term mistakes are predictable. Traders overtrade in choppy ranges, fight the dominant trend, rely on a single indicator, ignore the economic calendar, and move stops away from price to avoid taking a loss. Many also confuse a strong signal with a guarantee, forgetting that technical analysis deals in probabilities. Each setup is a bet with an edge, not a certainty, which is exactly why risk management decides whether you survive.
Sound risk management starts with position sizing. A common discipline is to risk only a small, fixed percentage of your account per trade, often one percent or less, so no single loss damages your capital. Always trade with a predefined stop, target a positive risk-reward ratio, and limit how many positions you hold at once. Keep a trading journal to review what works. Discipline, not prediction, is the real edge. This article is educational and does not constitute financial advice, and every price level shown here is an illustrative example for learning, not a recommendation to trade.
What Top Traders and Research Say
For a rigorous foundation, John J. Murphy’s Technical Analysis of the Financial Markets remains a standard reference, explaining trend, support and resistance, momentum, and patterns that underpin the methods in this guide. For currency-specific tactics, Kathy Lien’s Day Trading and Swing Trading the Currency Market directly addresses short-term forex, including how data and rate differentials move pairs like USD/CAD.
On the academic side, the influential study by Andrew Lo, Harry Mamaysky, and Jiang Wang, “Foundations of Technical Analysis” (2000), found that certain technical patterns can carry statistically meaningful information, lending measured credibility to disciplined chart analysis. Research on commodity currencies likewise documents the persistent link between crude oil and the Canadian dollar, supporting the oil correlation discussed above.
On mindset, the trader Paul Tudor Jones is widely quoted as saying, “The most important rule of trading is to play great defense.” It captures why risk management, not prediction, sits at the center of any sustainable short-term approach.
Frequently Asked Questions
What timeframe is best for USD/CAD short-term technical analysis?
There is no single best timeframe. Most short-term traders use multi-timeframe analysis, reading the daily and 4-hour charts for bias and the 1-hour or 15-minute charts for entries. Scalpers go lower, swing traders go higher. The key is keeping your timeframes aligned so your entries follow the dominant trend rather than fighting it.
How does oil affect USD/CAD?
Canada is a major oil exporter, so crude prices and the Canadian dollar are closely linked. When oil rises, the Loonie often strengthens and USD/CAD tends to fall; when oil drops, USD/CAD tends to rise. The relationship is inverse but not constant, so traders use oil as a confirming signal alongside their chart, not as a guarantee.
Which indicators work best for the Loonie?
No indicator works alone. Short-term USD/CAD traders combine moving averages for direction, RSI and MACD for momentum, and Fibonacci levels for pullback entries, always confirmed by support, resistance, and candlestick patterns. Confluence among several tools at a key zone is far more reliable than any single signal in isolation.
How do news events impact short-term USD/CAD trading?
High-impact events like Fed and Bank of Canada decisions, US nonfarm payrolls, and CPI can cause sharp moves and wider spreads. Many short-term traders reduce exposure before these releases and wait for the initial volatility to settle, then trade the cleaner structure that forms afterward at confirmed technical levels.
Are the price levels in this article real signals?
No. Every price level here is a hypothetical teaching example used to illustrate how the framework works. They are not live quotes, forecasts, or trade signals. Always run your own analysis on current charts and apply strict risk management before making any decision.
Final Thoughts
Mastering usd/cad short-term technical analysis comes down to a repeatable process rather than a magic indicator. Understand what drives the Loonie, from oil prices and Bank of Canada versus Fed policy to US data and risk sentiment. Map your trend and key zones across aligned timeframes, confirm momentum with RSI, MACD, and stochastic, refine entries with Fibonacci and candlesticks, and respect volume and the economic calendar. Then translate that read into a written trade plan with defined entries, stops, and targets, protected by disciplined risk management. The same framework powers our eur/usd technical analysis october 2025 and gbp/jpy forex market analysis december 2025 breakdowns, so once you learn it, you can apply it across pairs. Remember that all levels here are illustrative and educational, not financial advice. For more pair-by-pair breakdowns, indicator guides, and trade-planning frameworks, explore the latest analysis at forexmarkettrendss.com and sharpen your edge one session at a time.